Entity-Relationship Diagrams

Most tables have have an id, or key, column that contains a number unique to that row within its table. The id can be used, in perpetuity, to refer to its related row and distinguish it from all the other rows of the table. Ids are arbitrary, although for convenience they are often sequentially generated integers. The name of the column is not always Id, although it sometimes is.

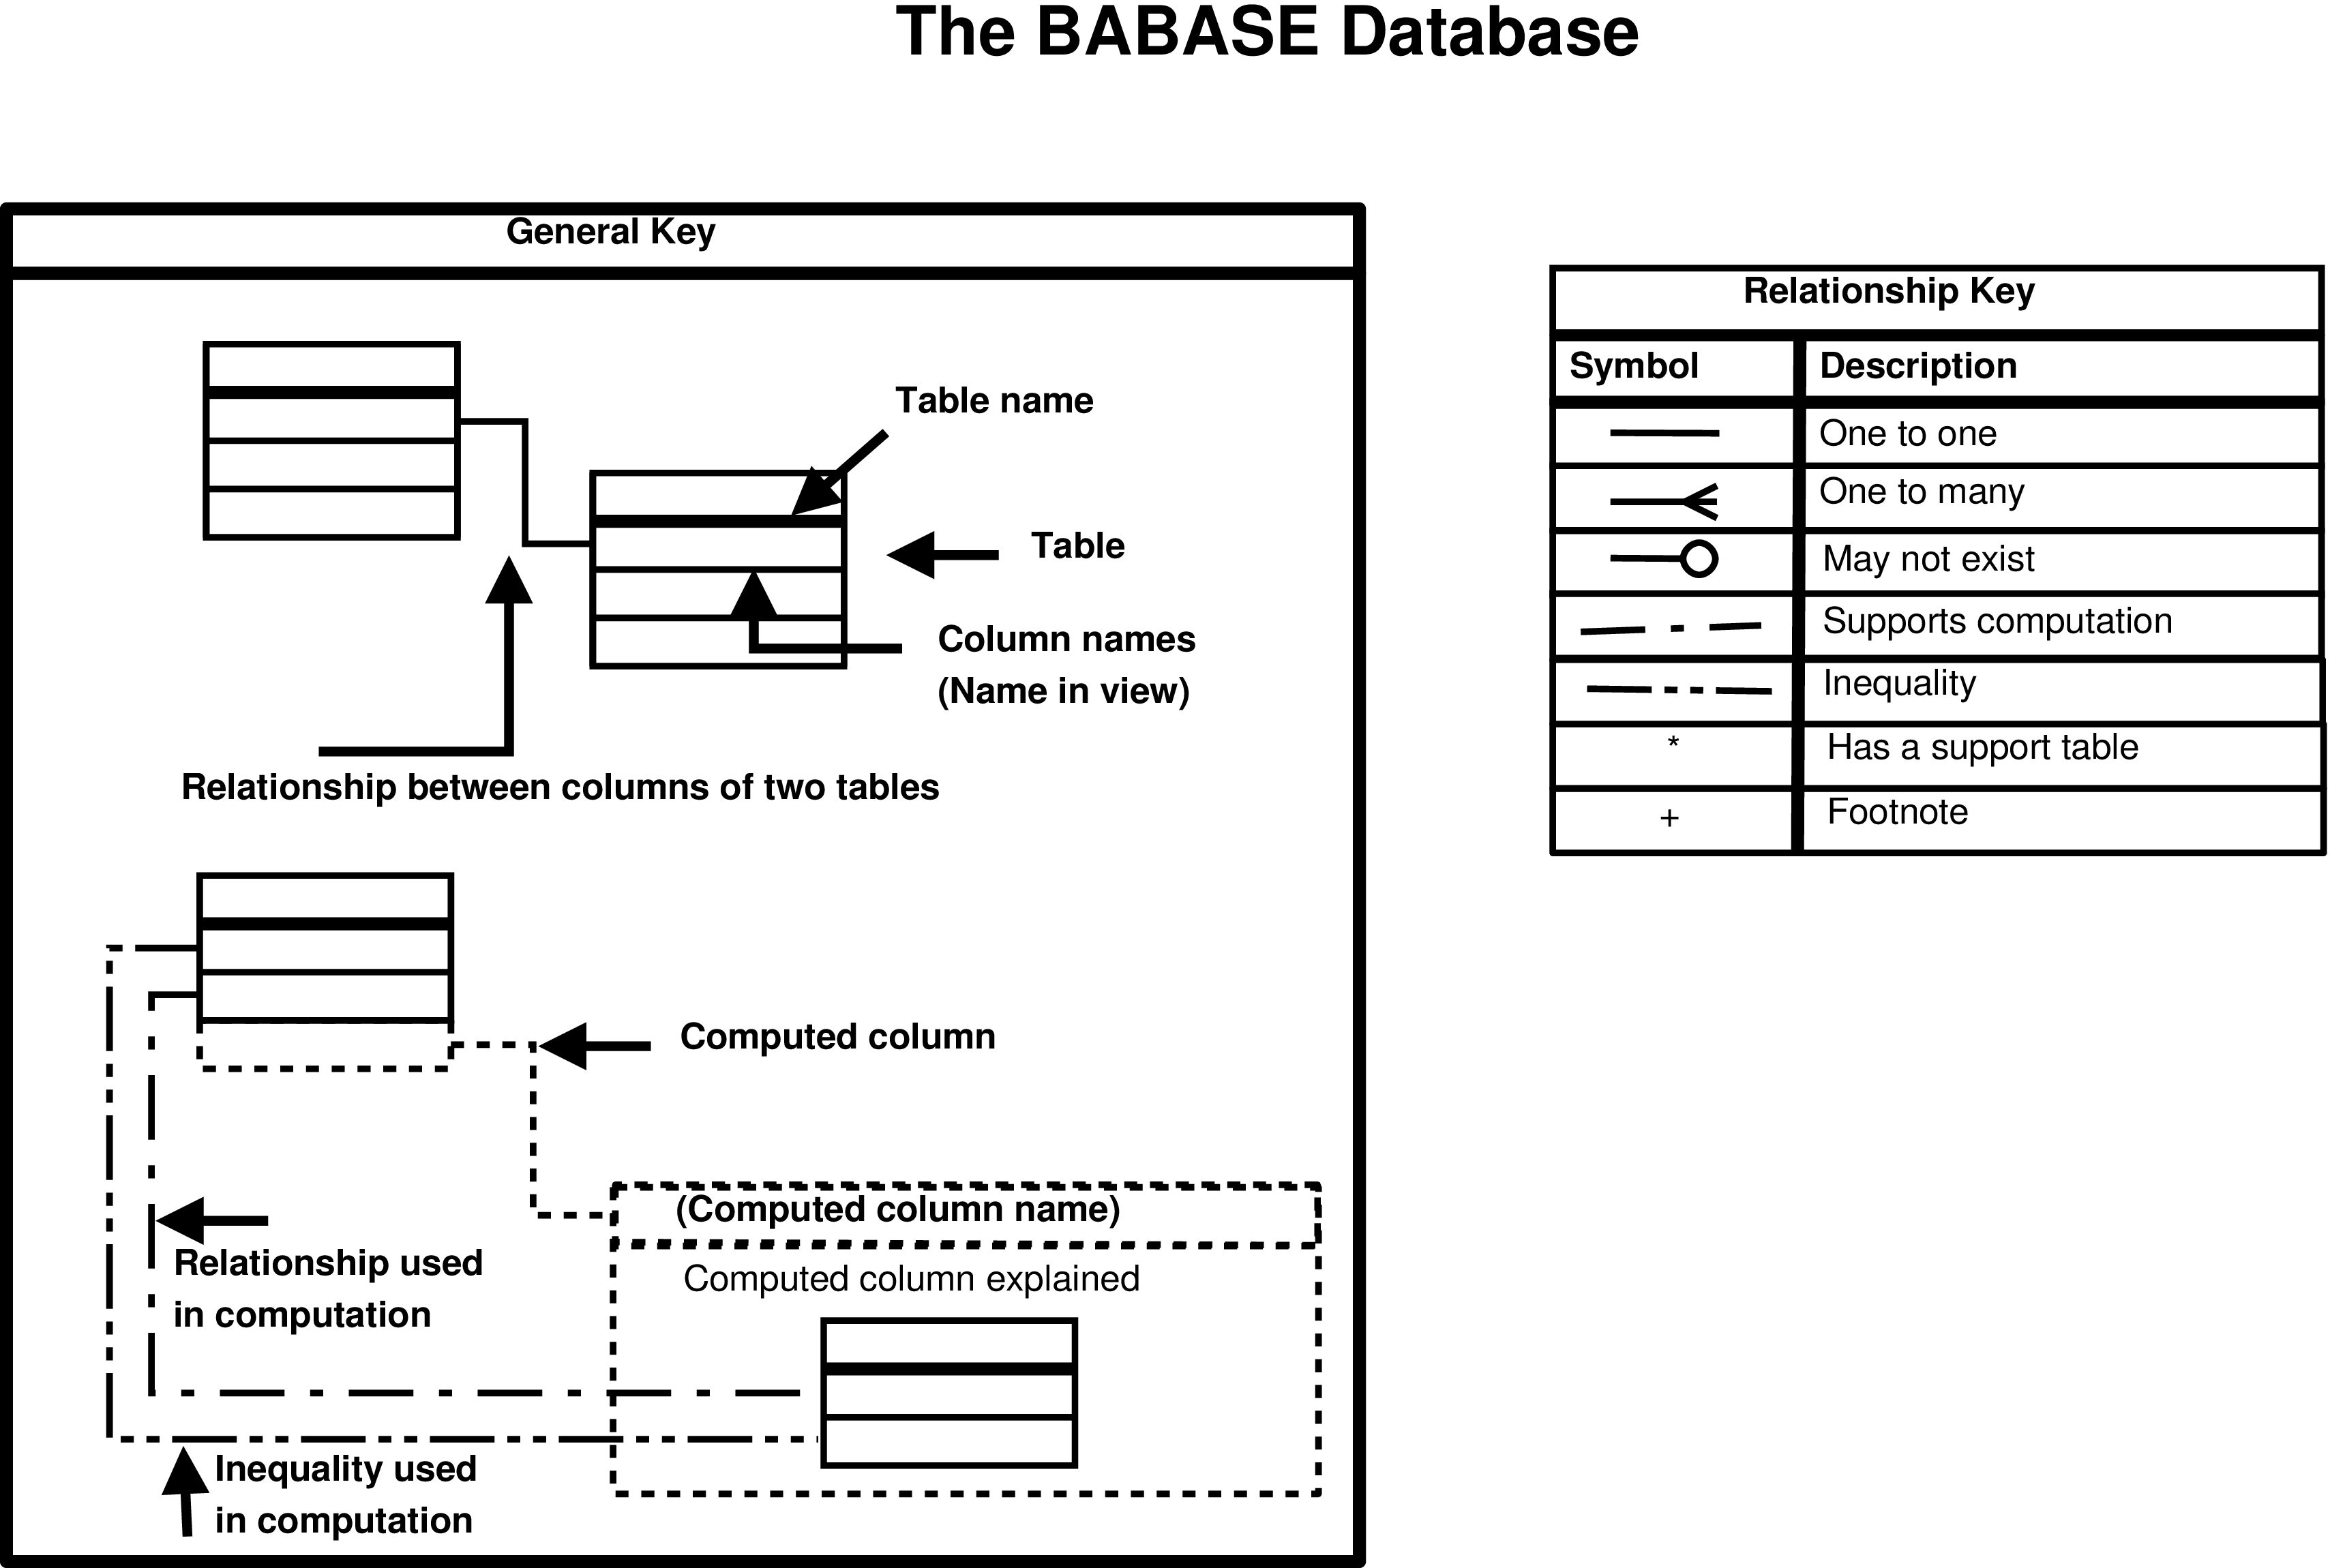
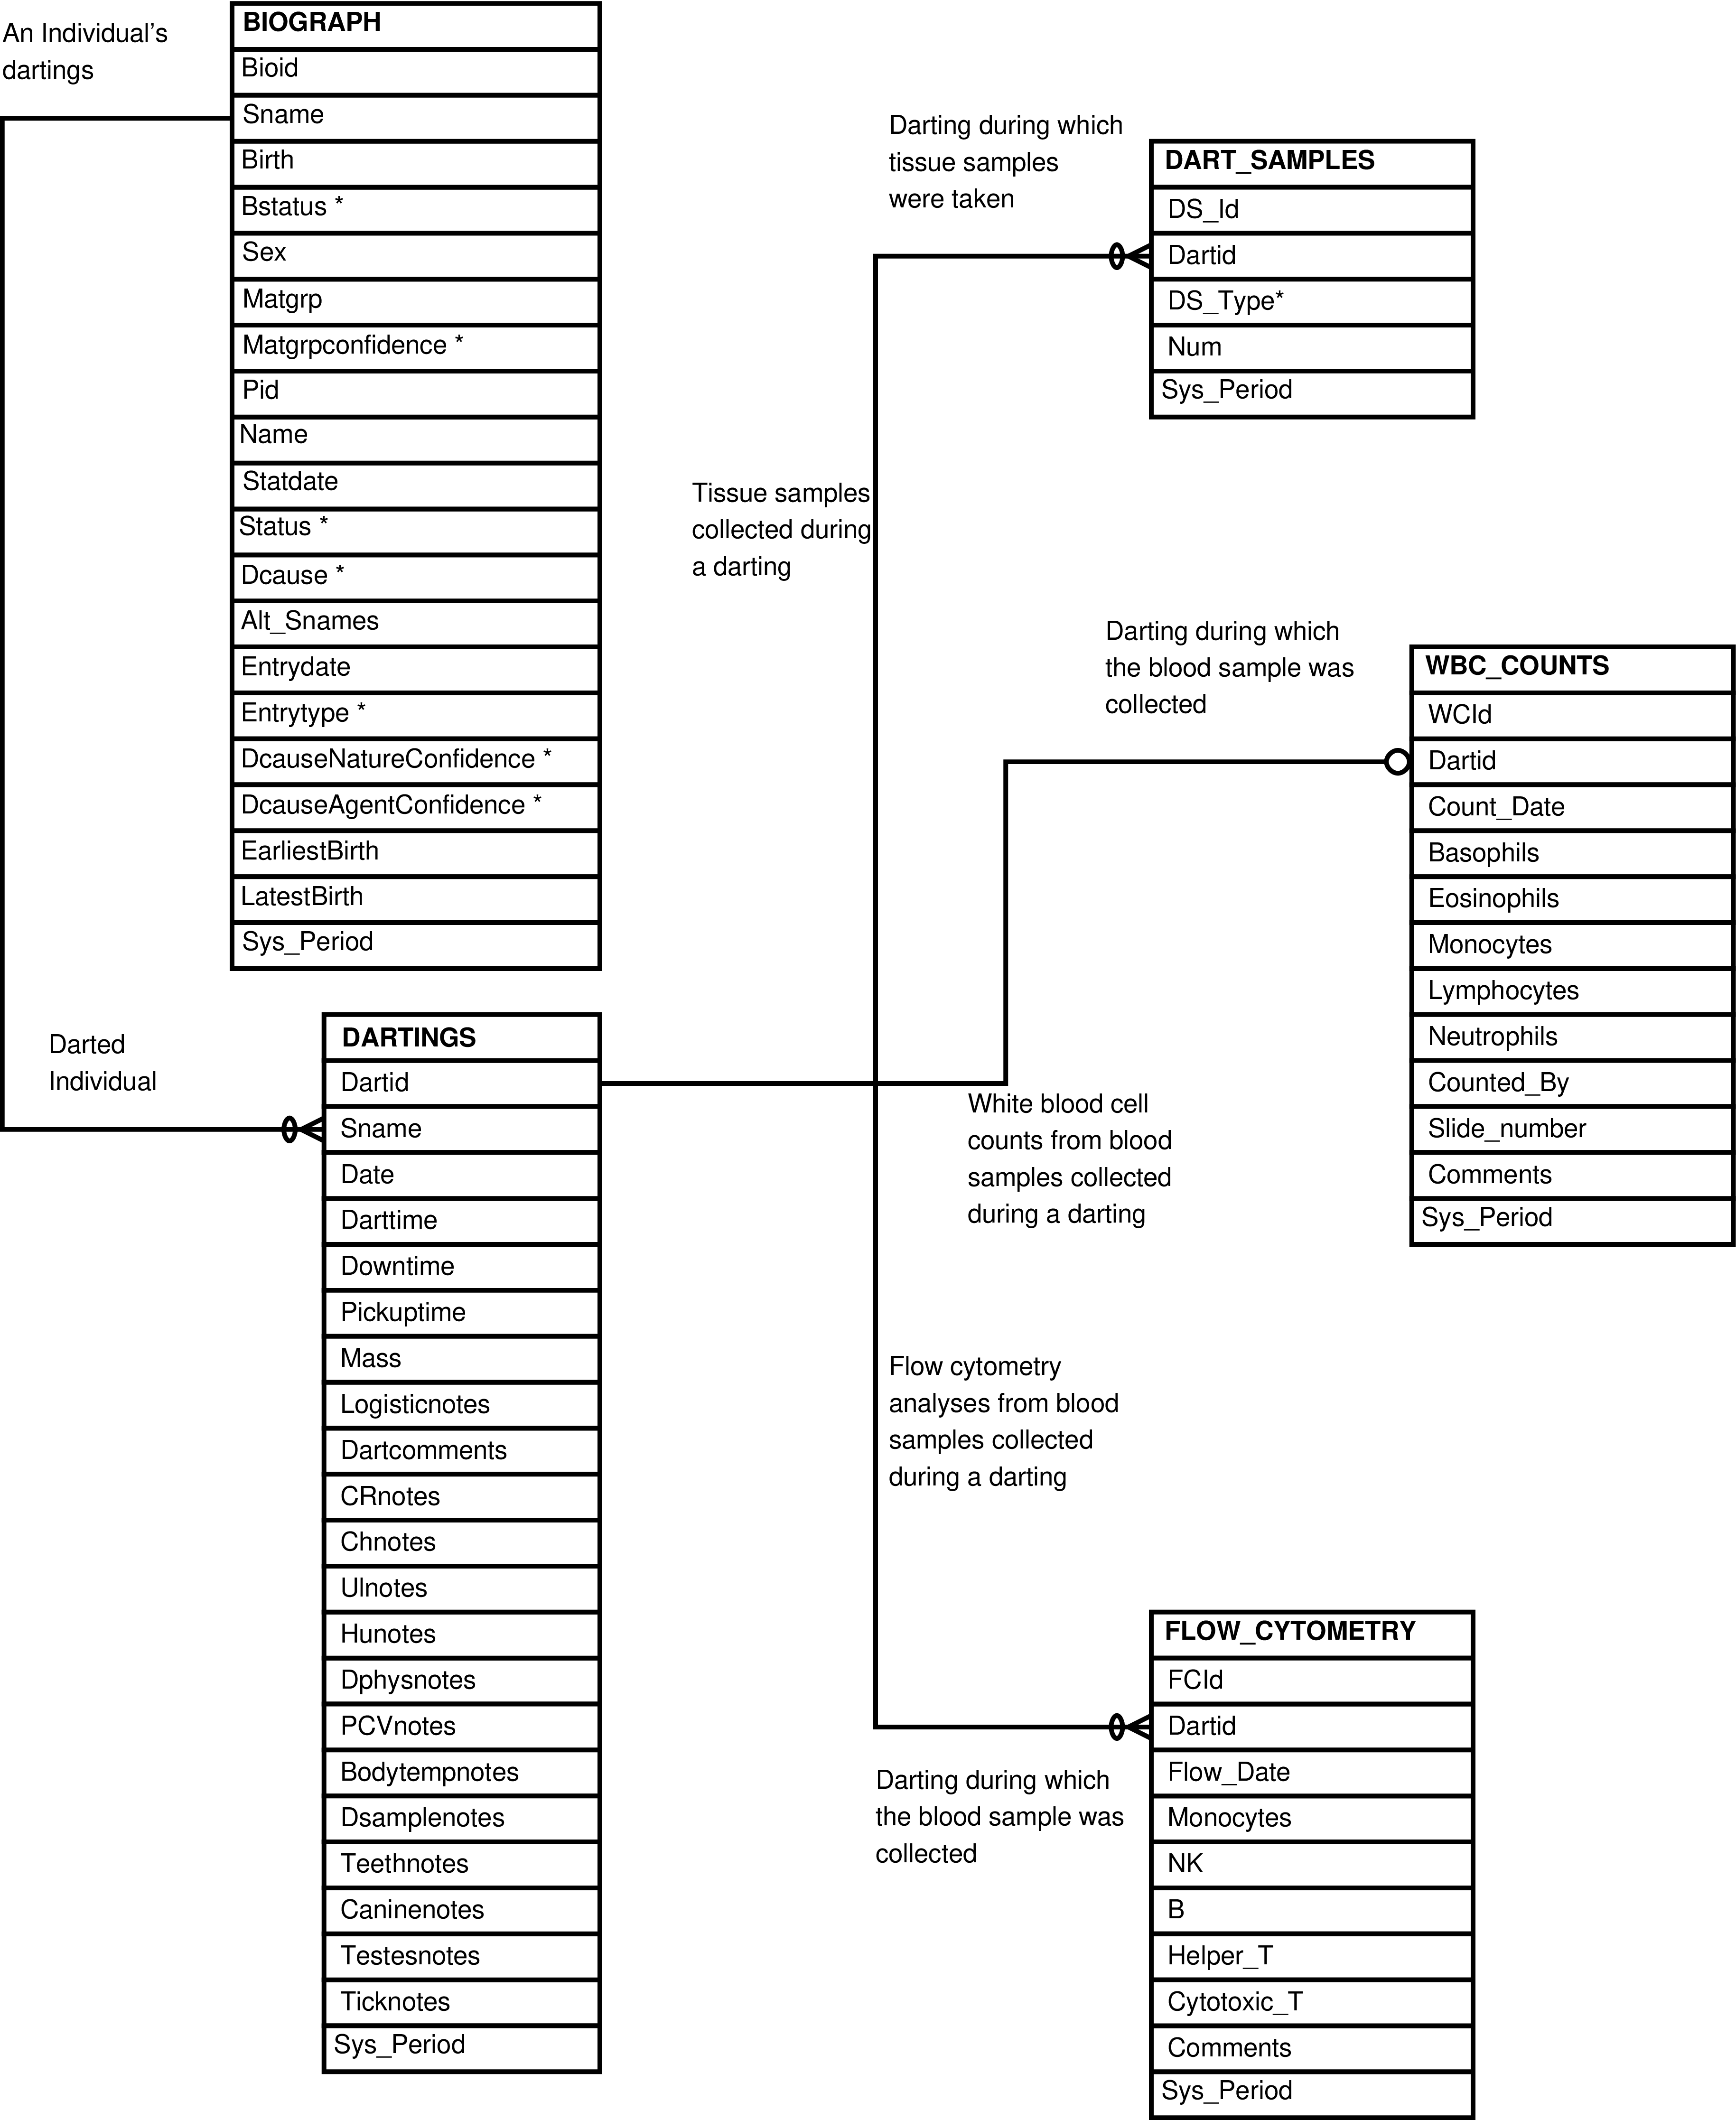
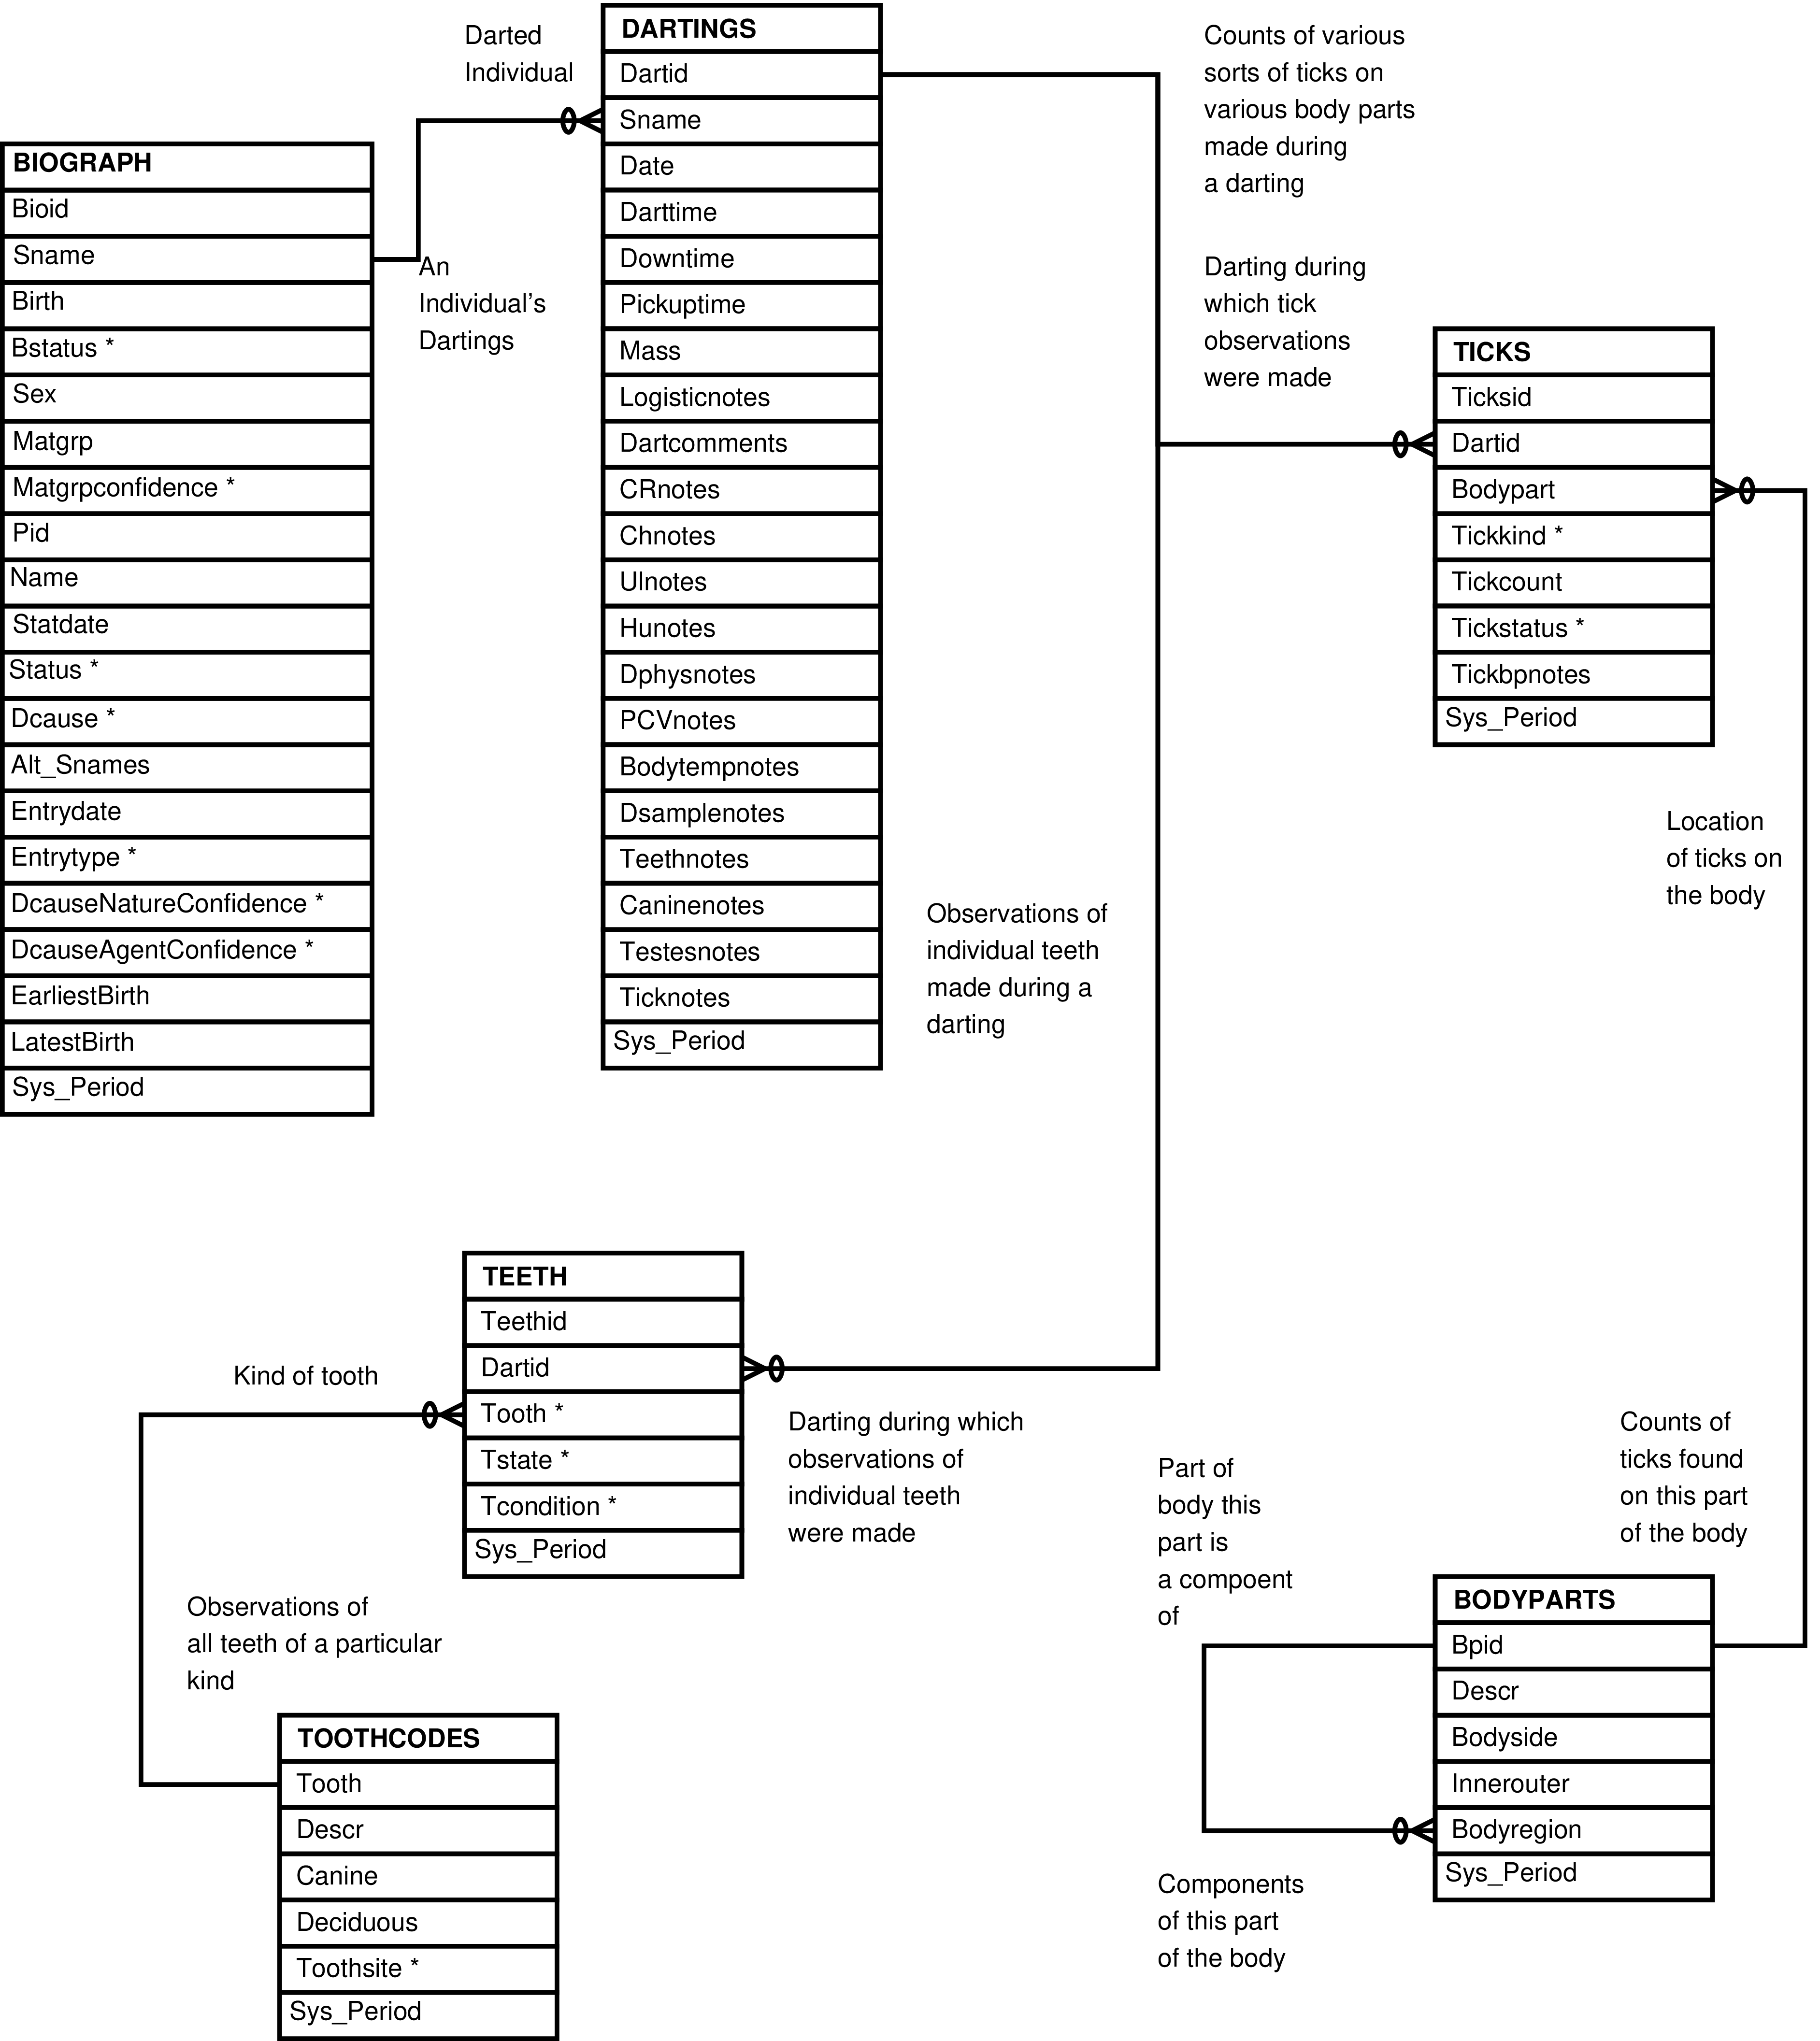
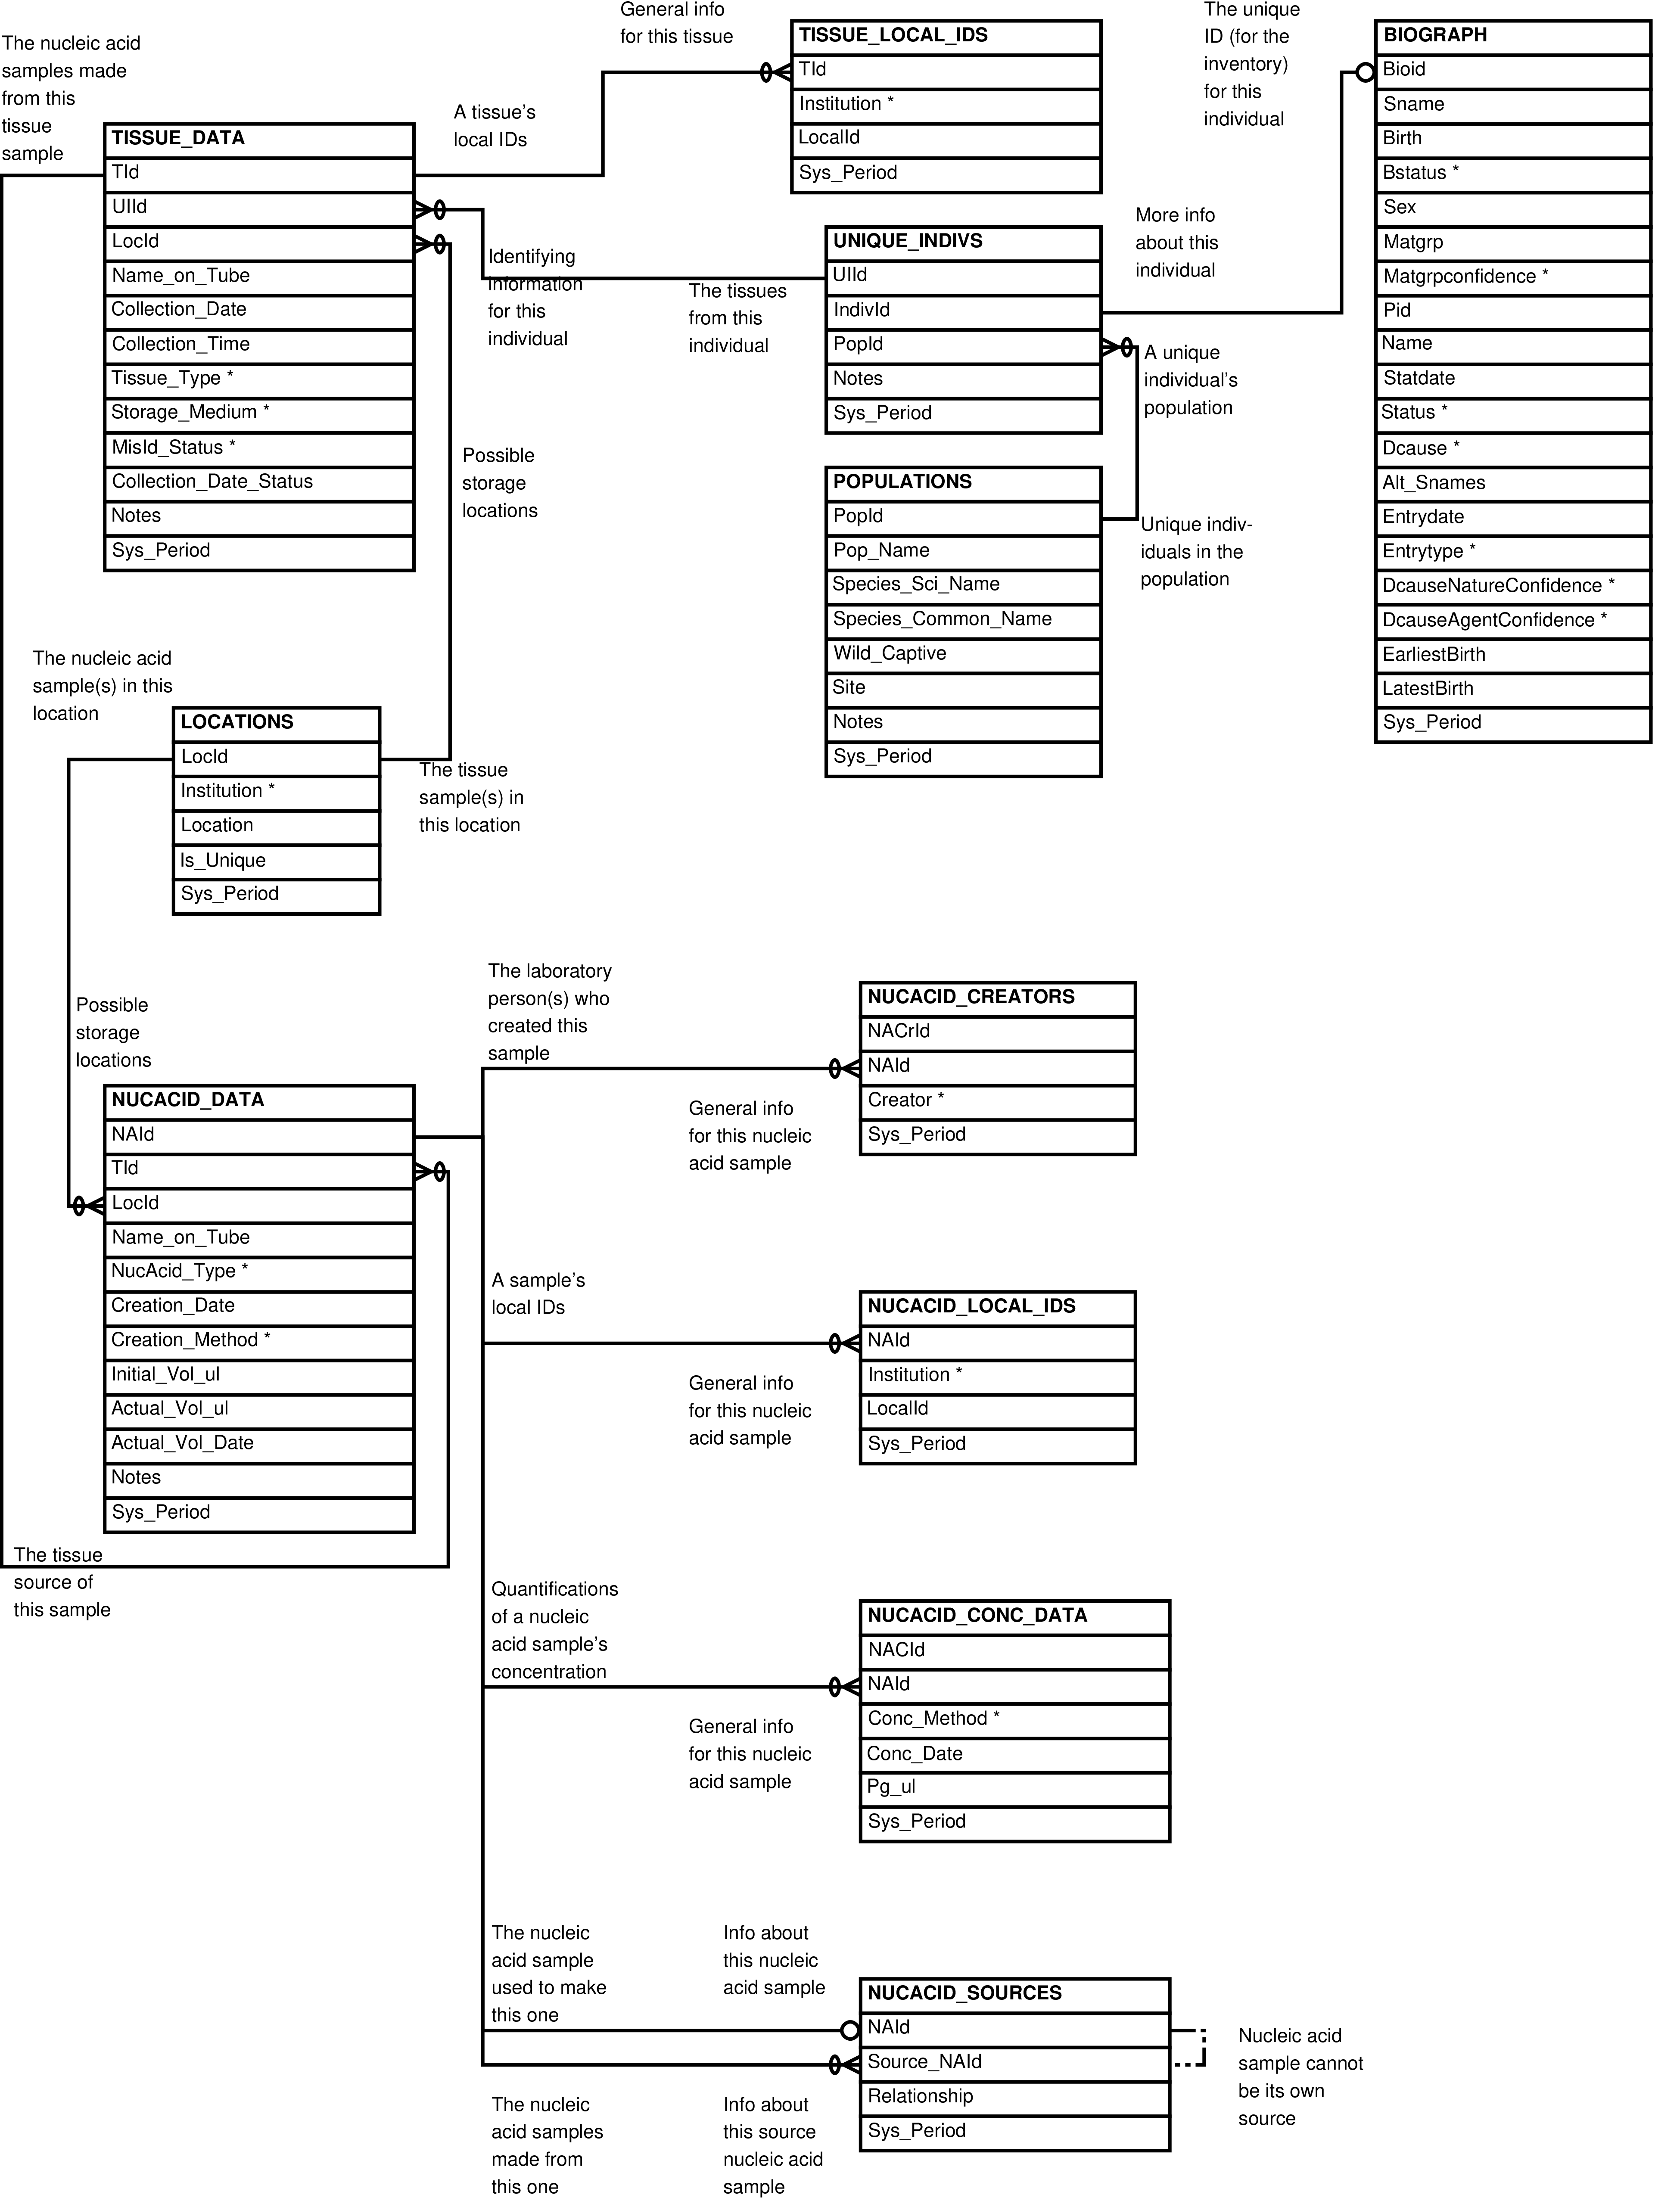
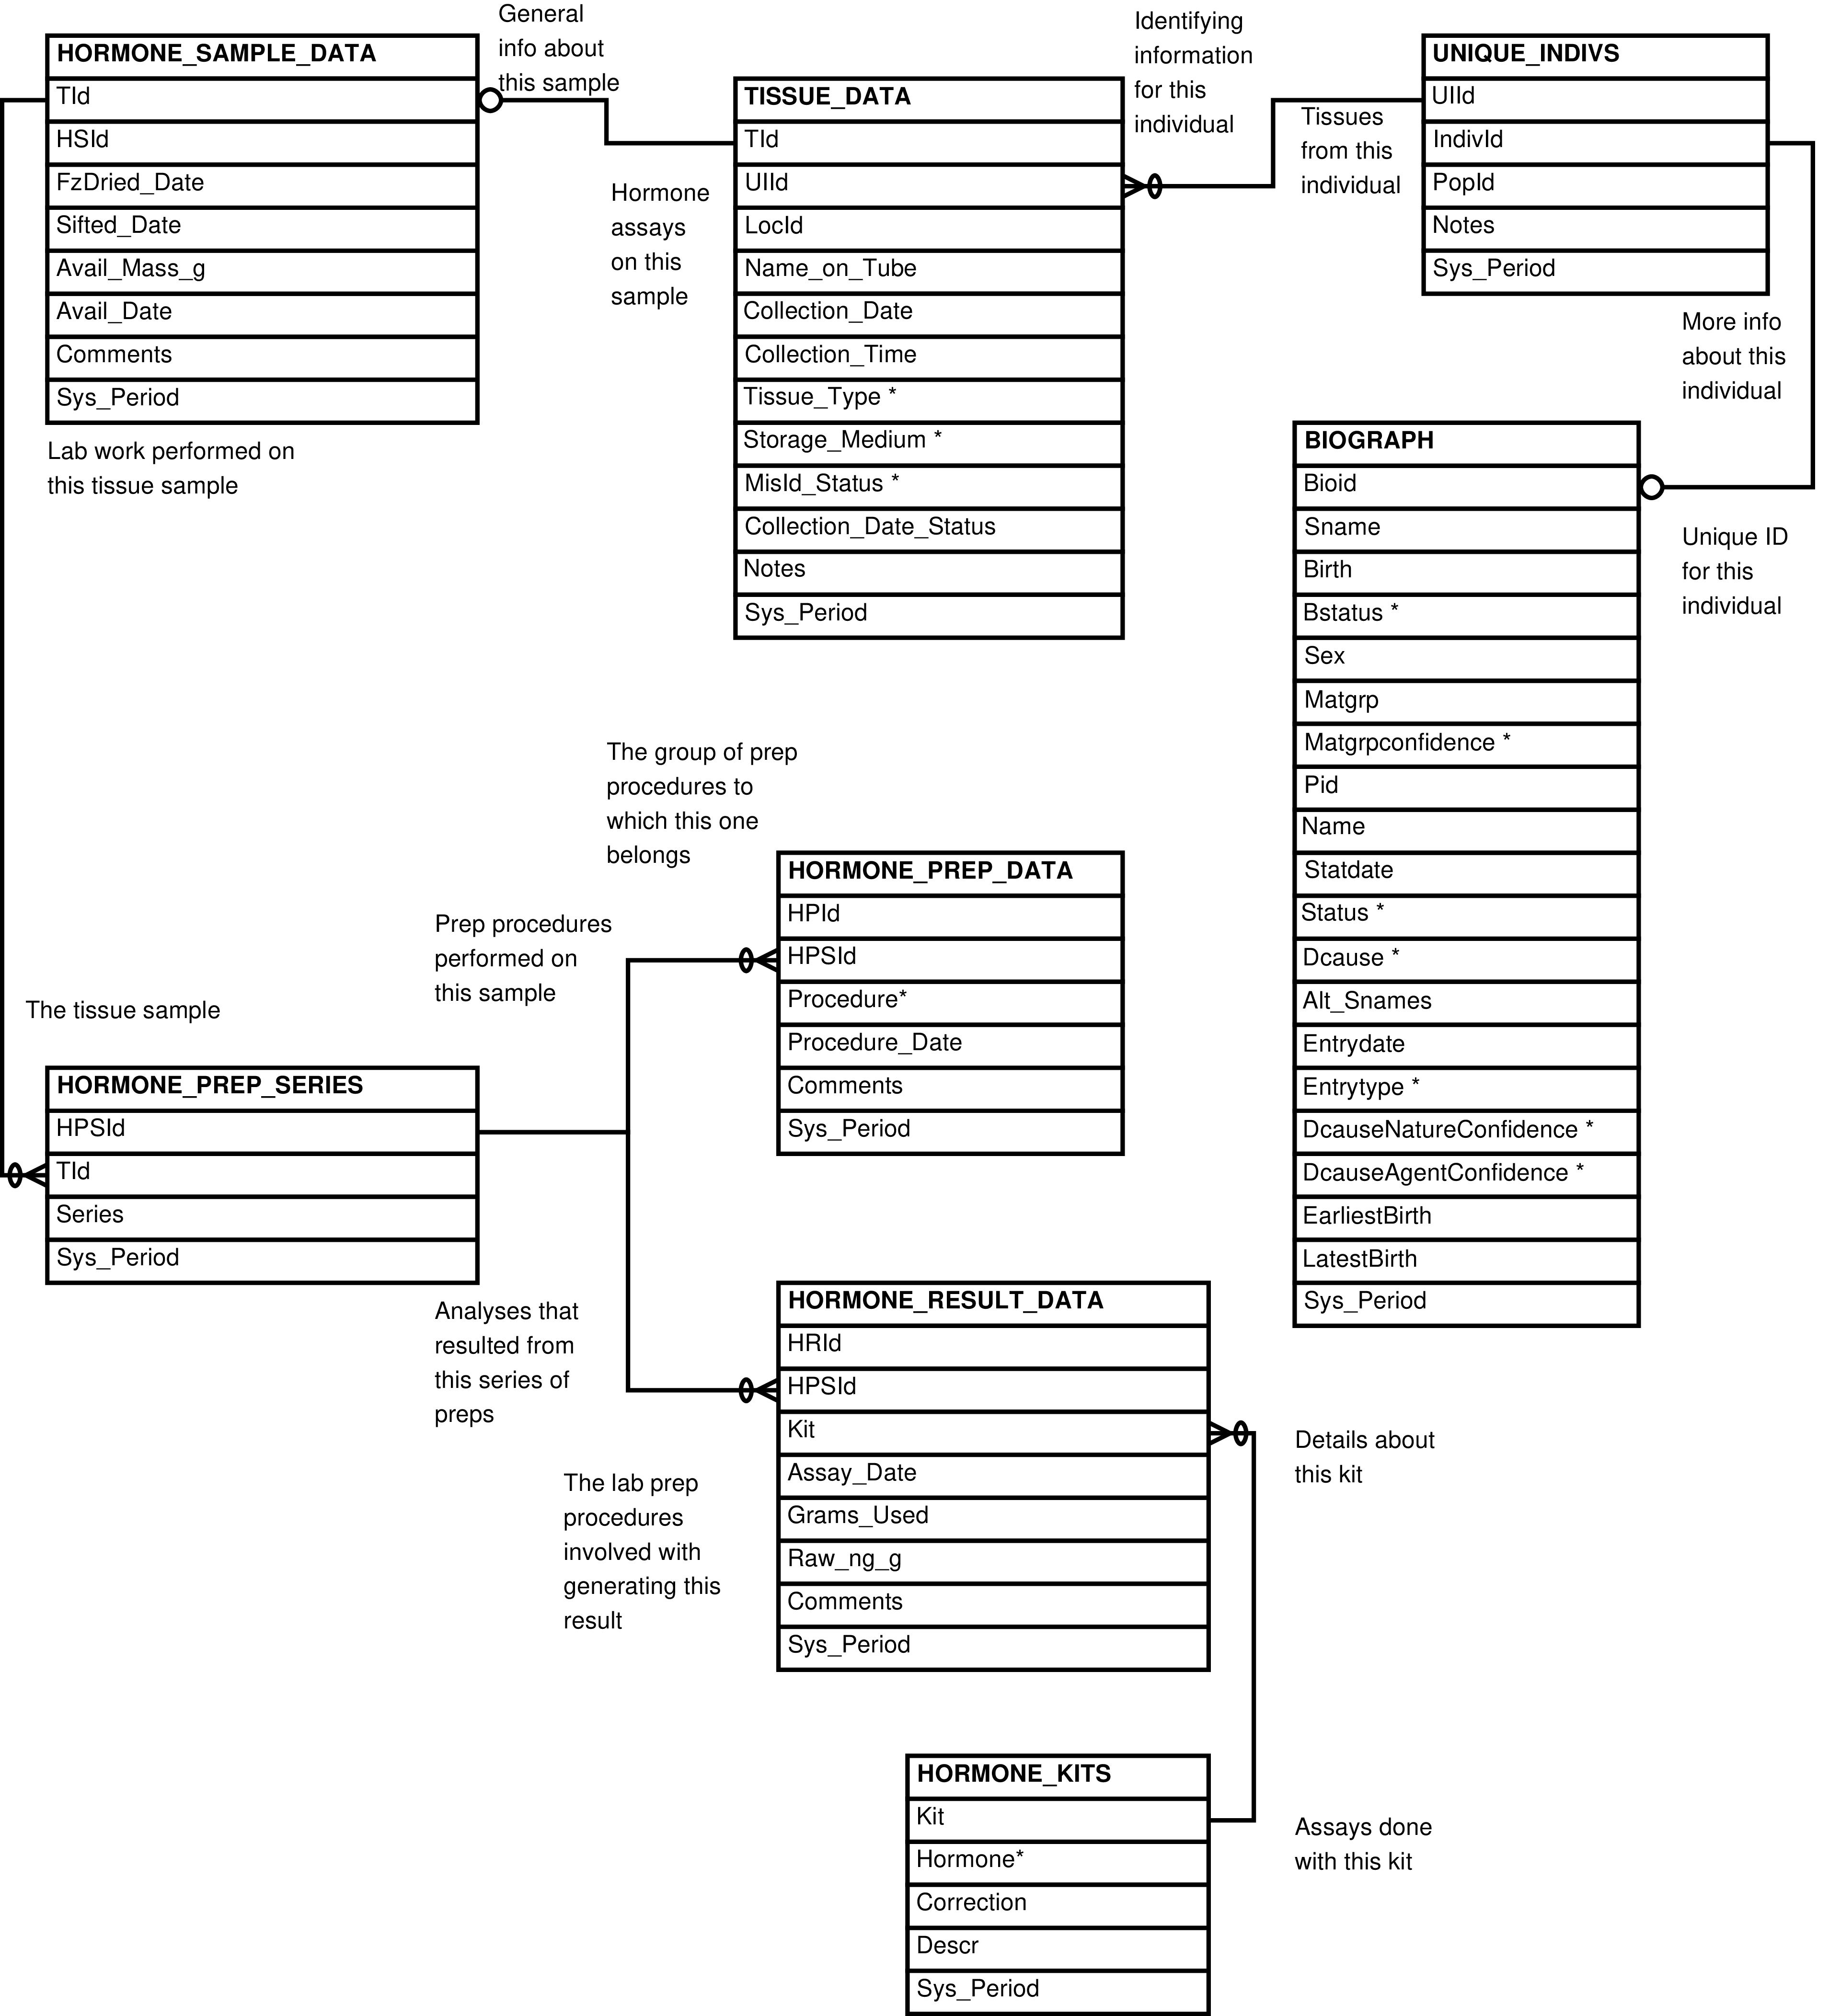
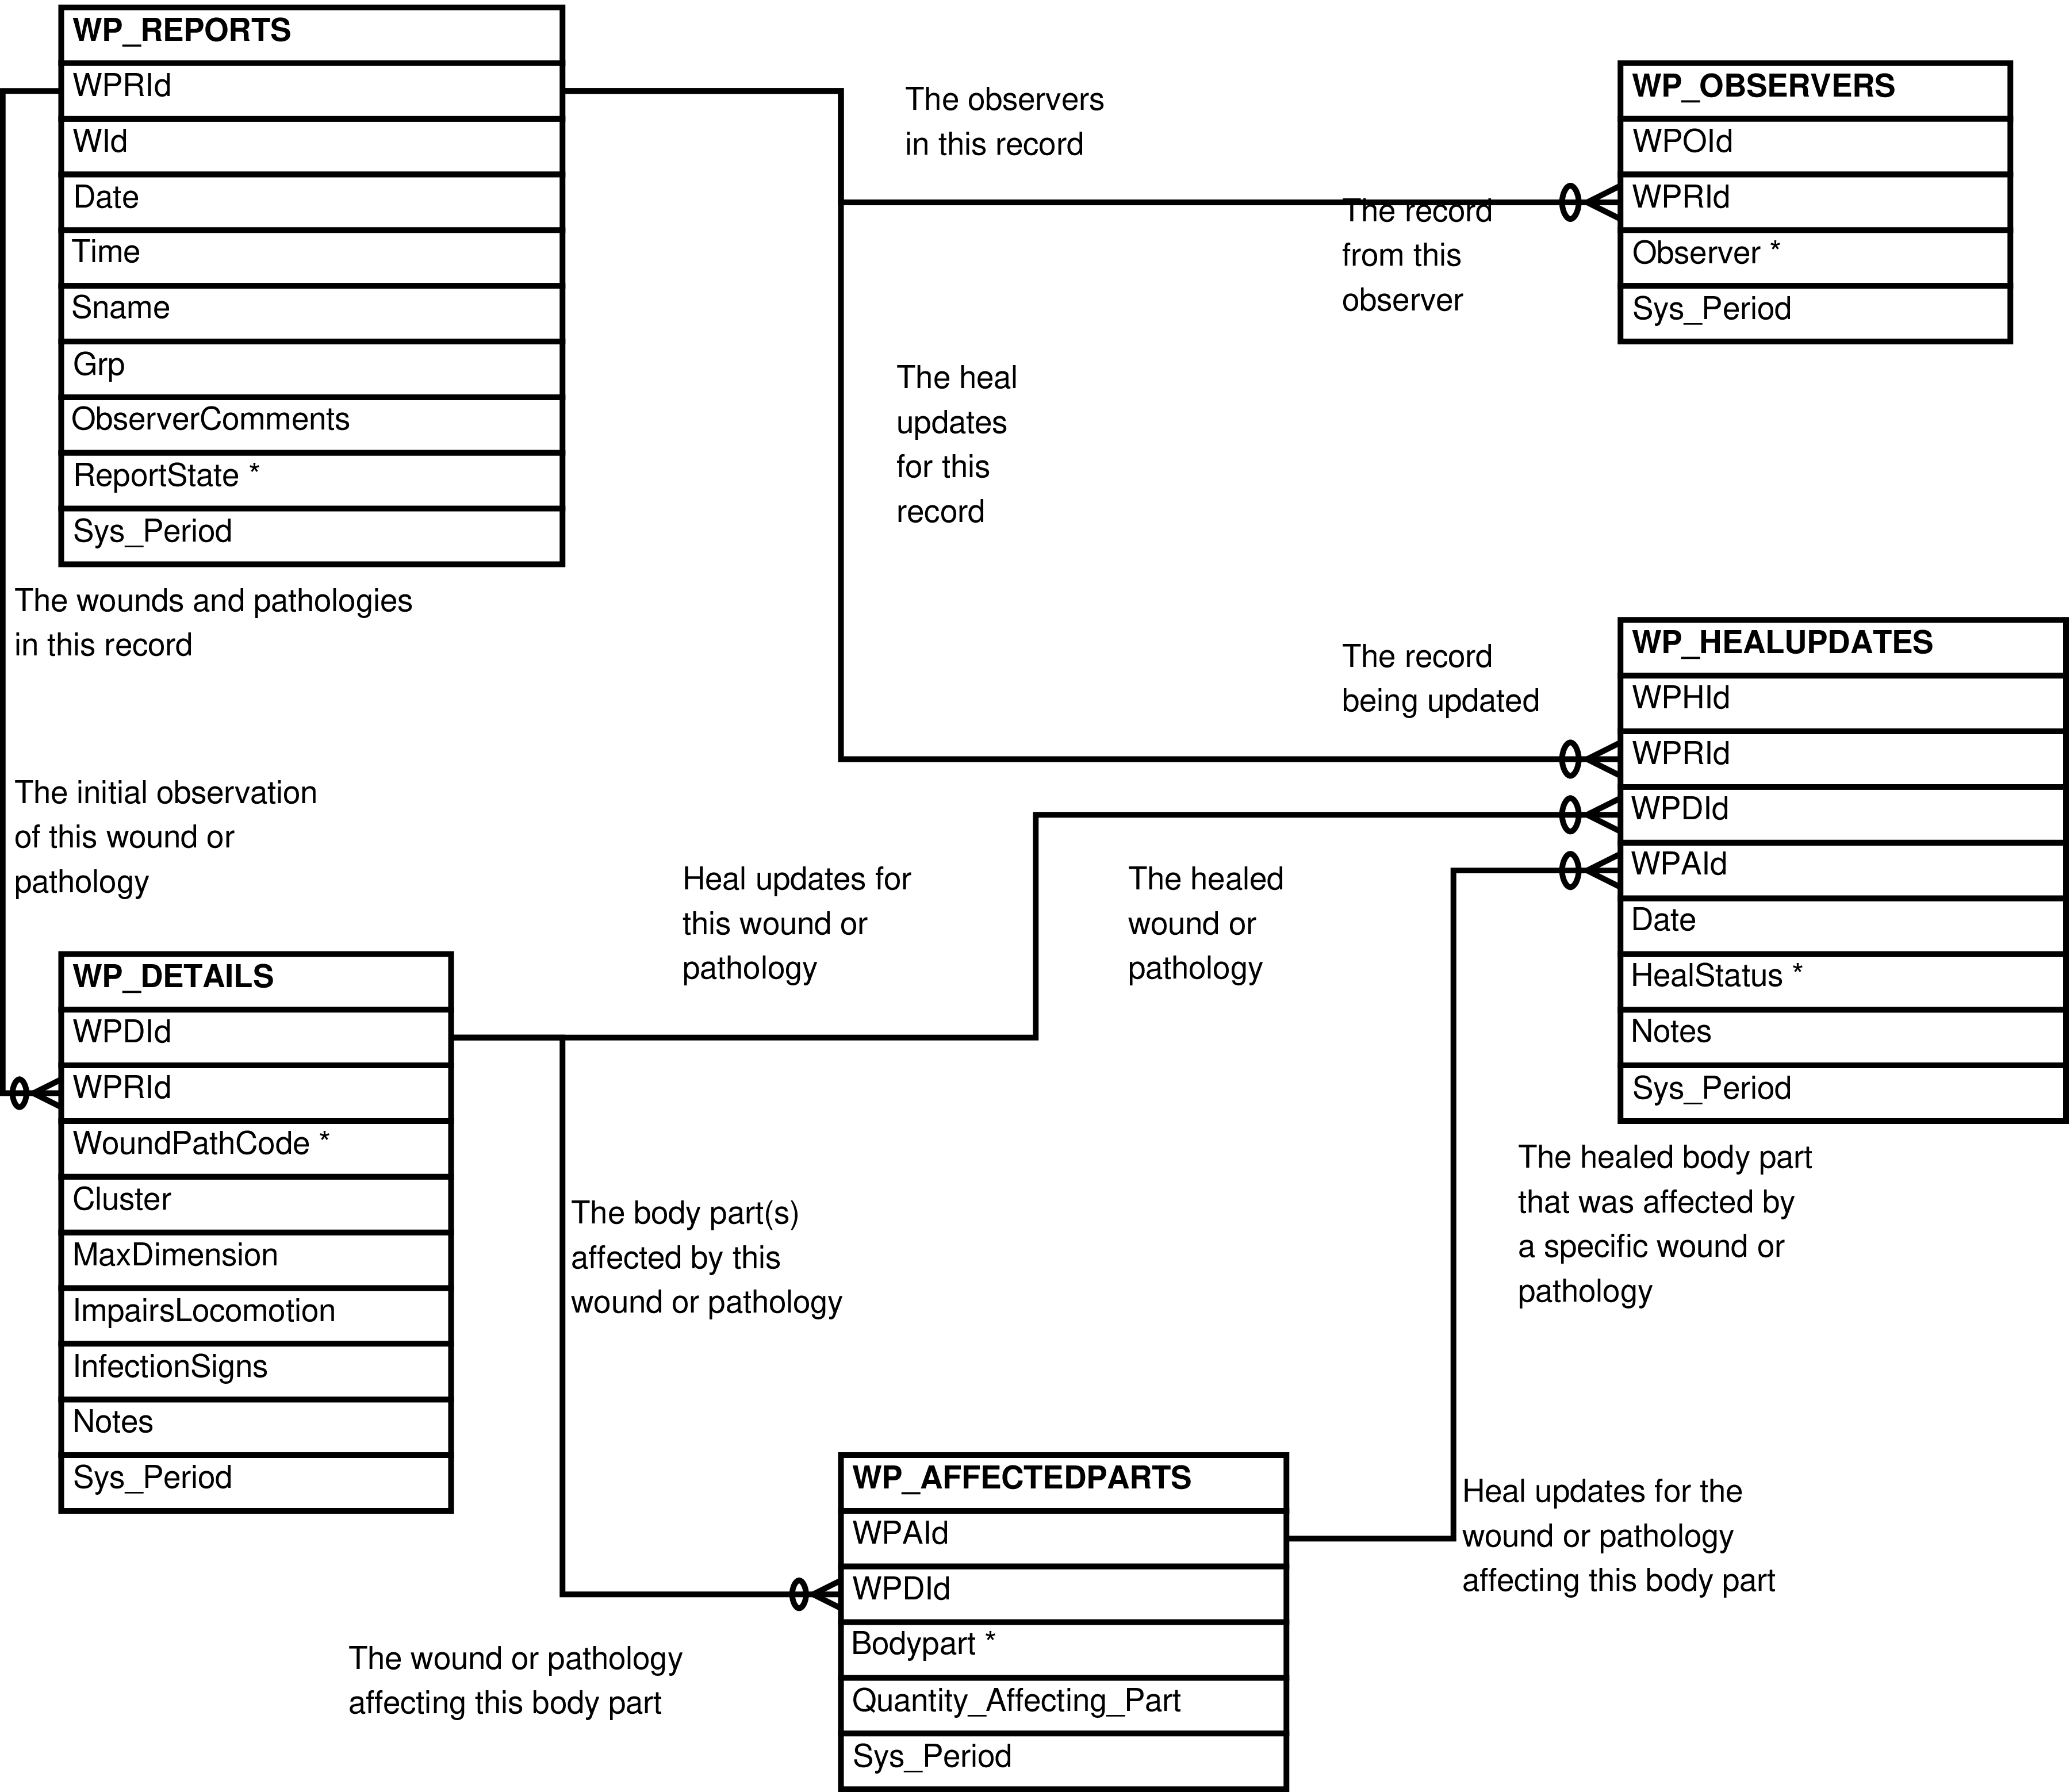
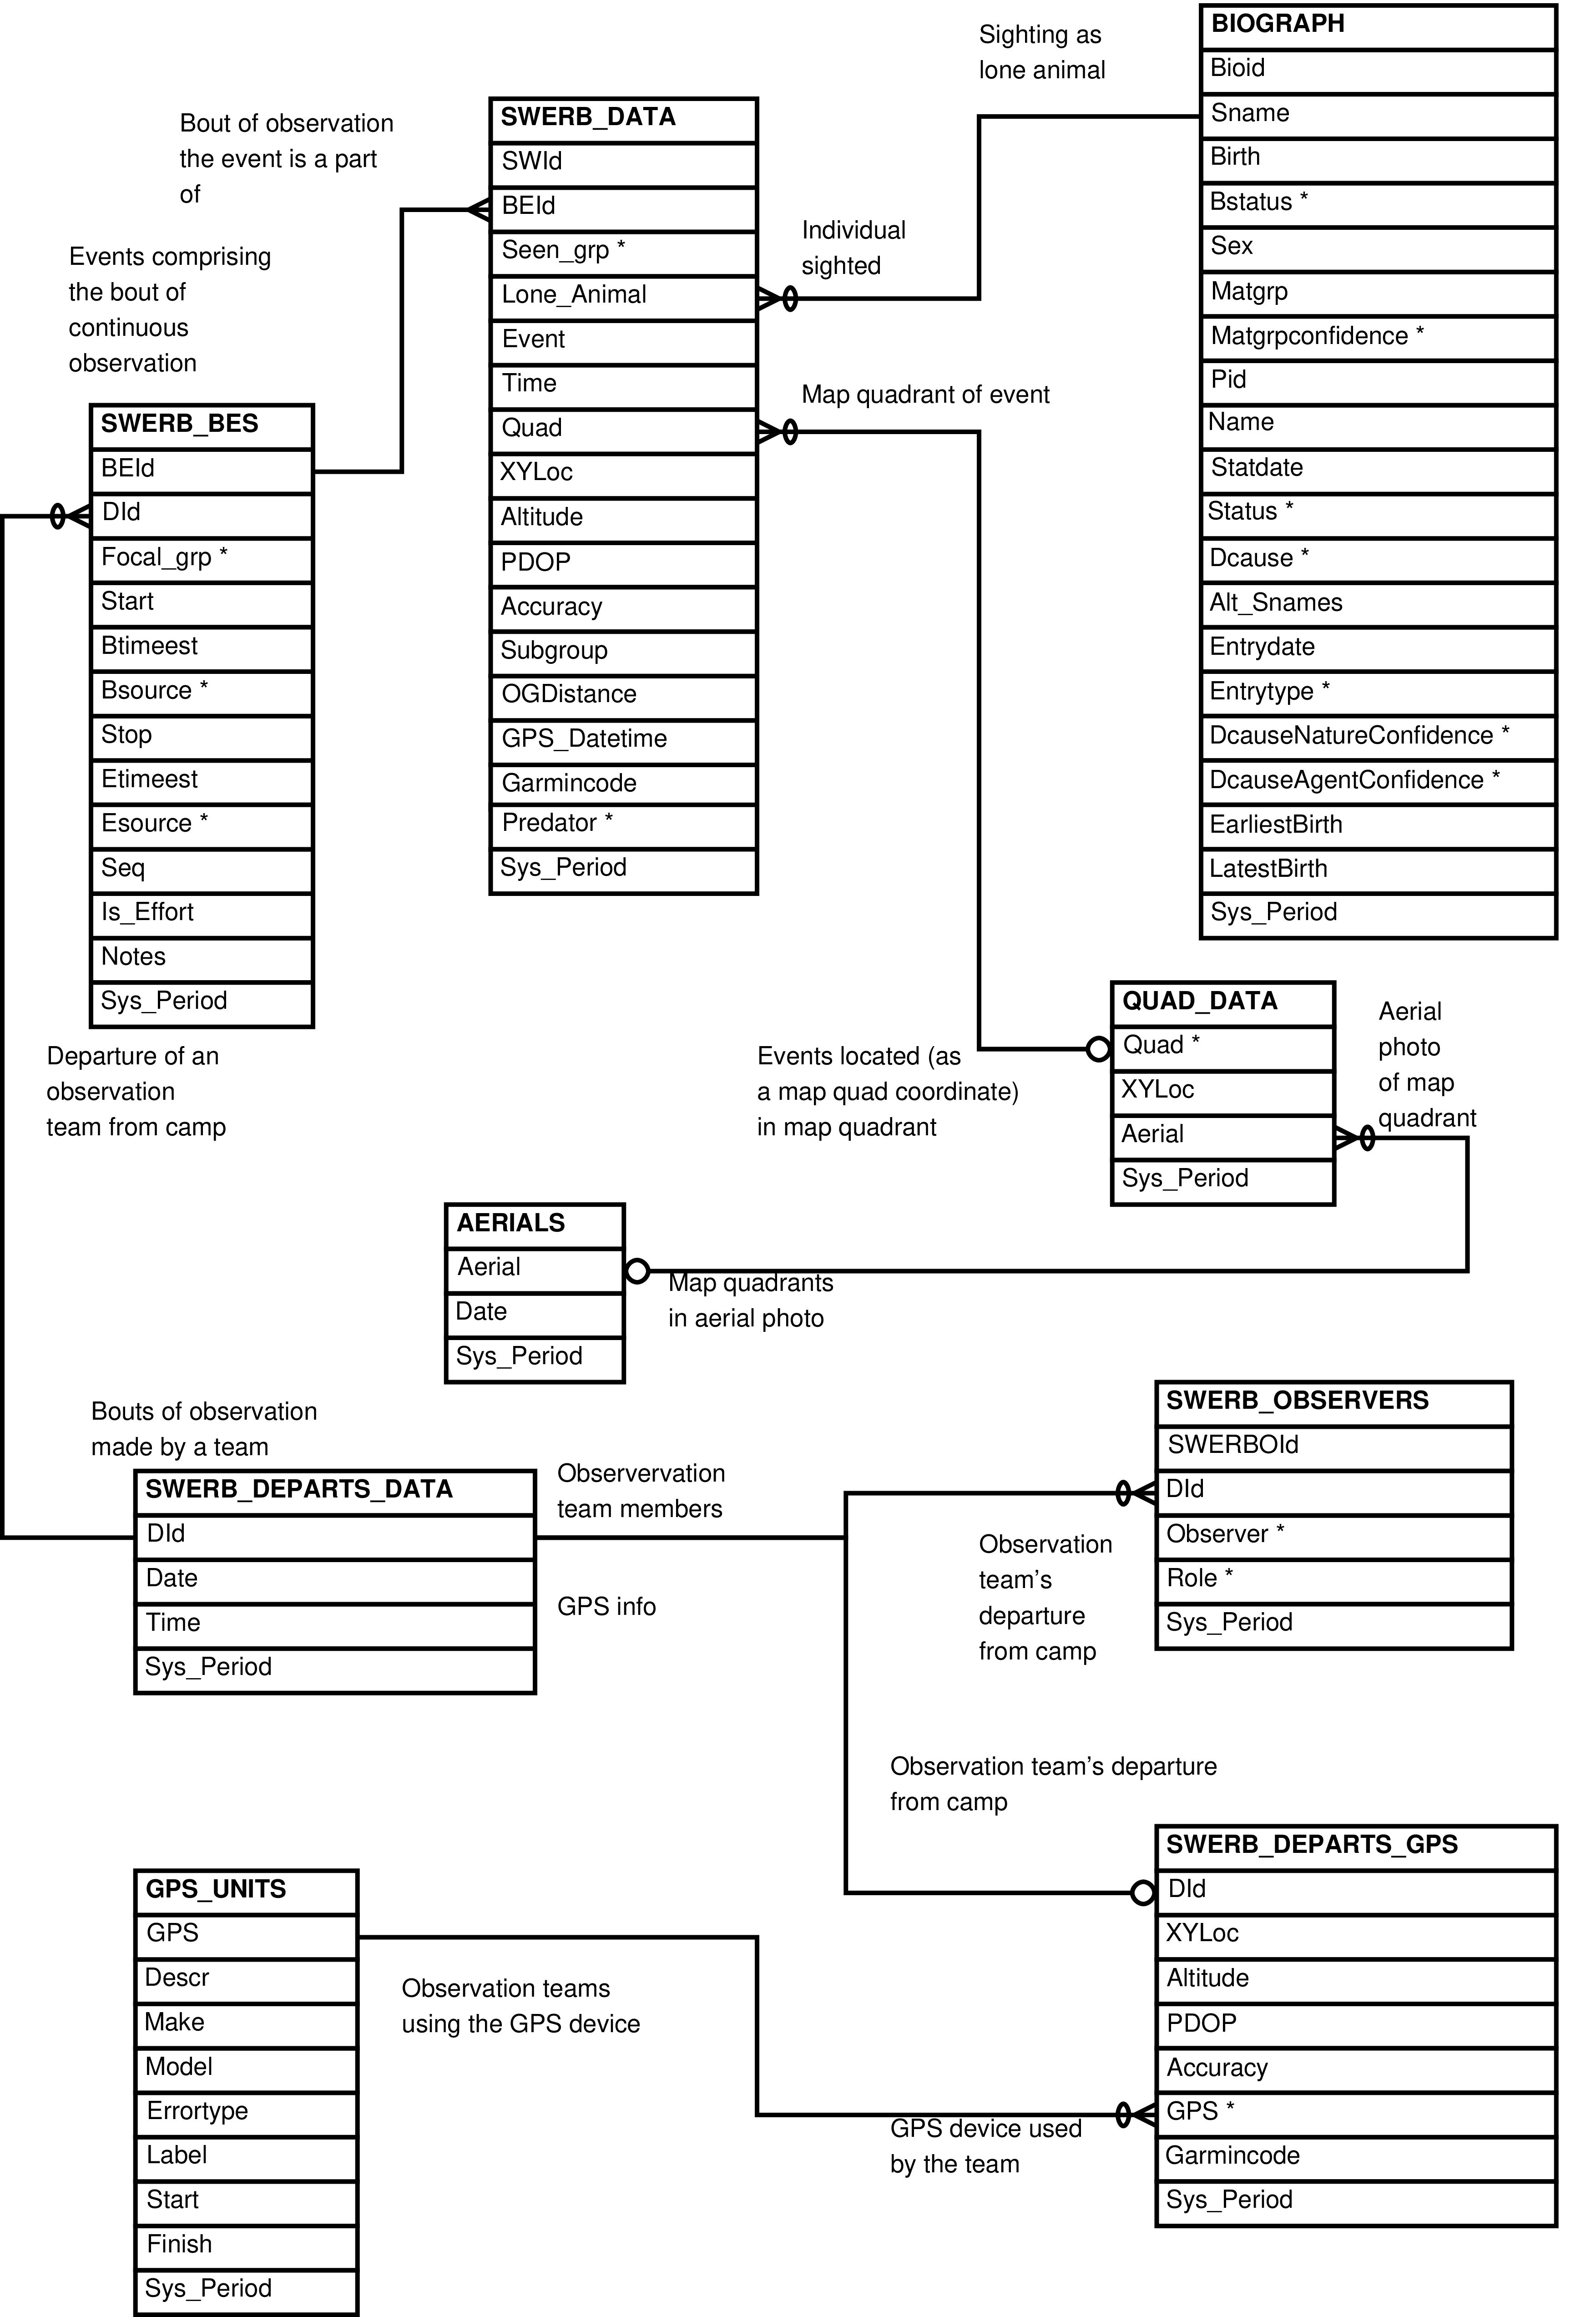
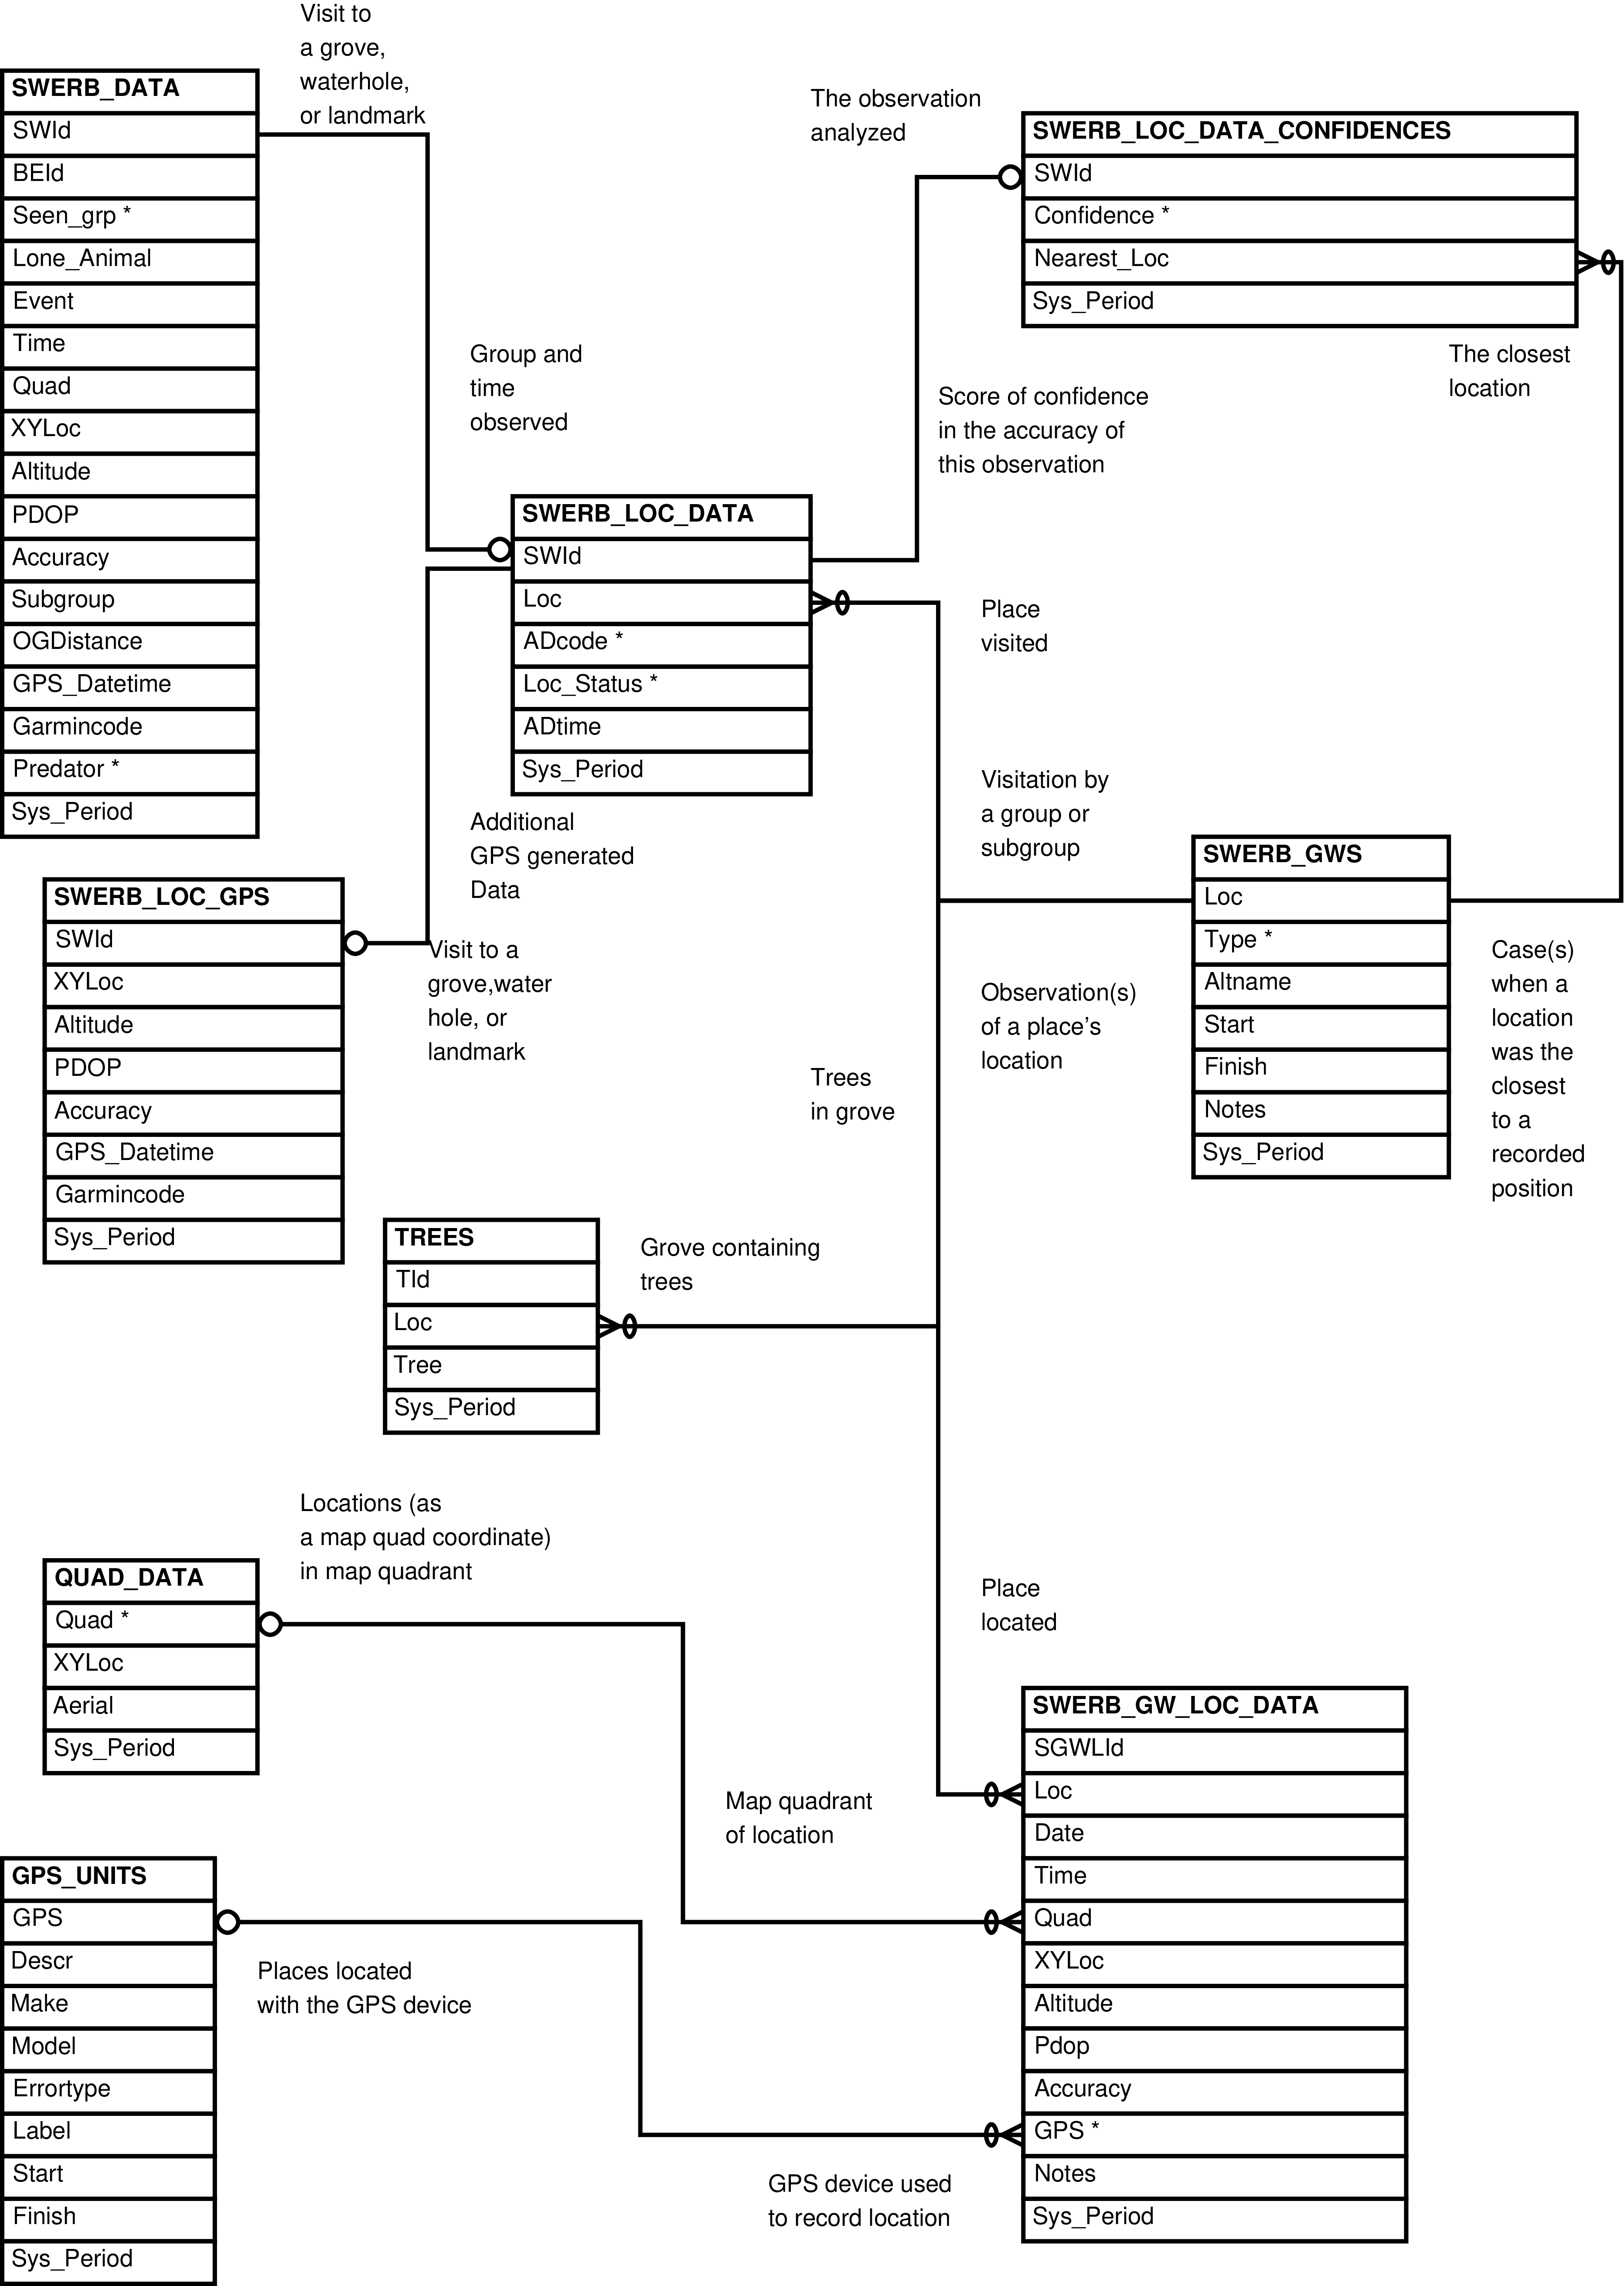
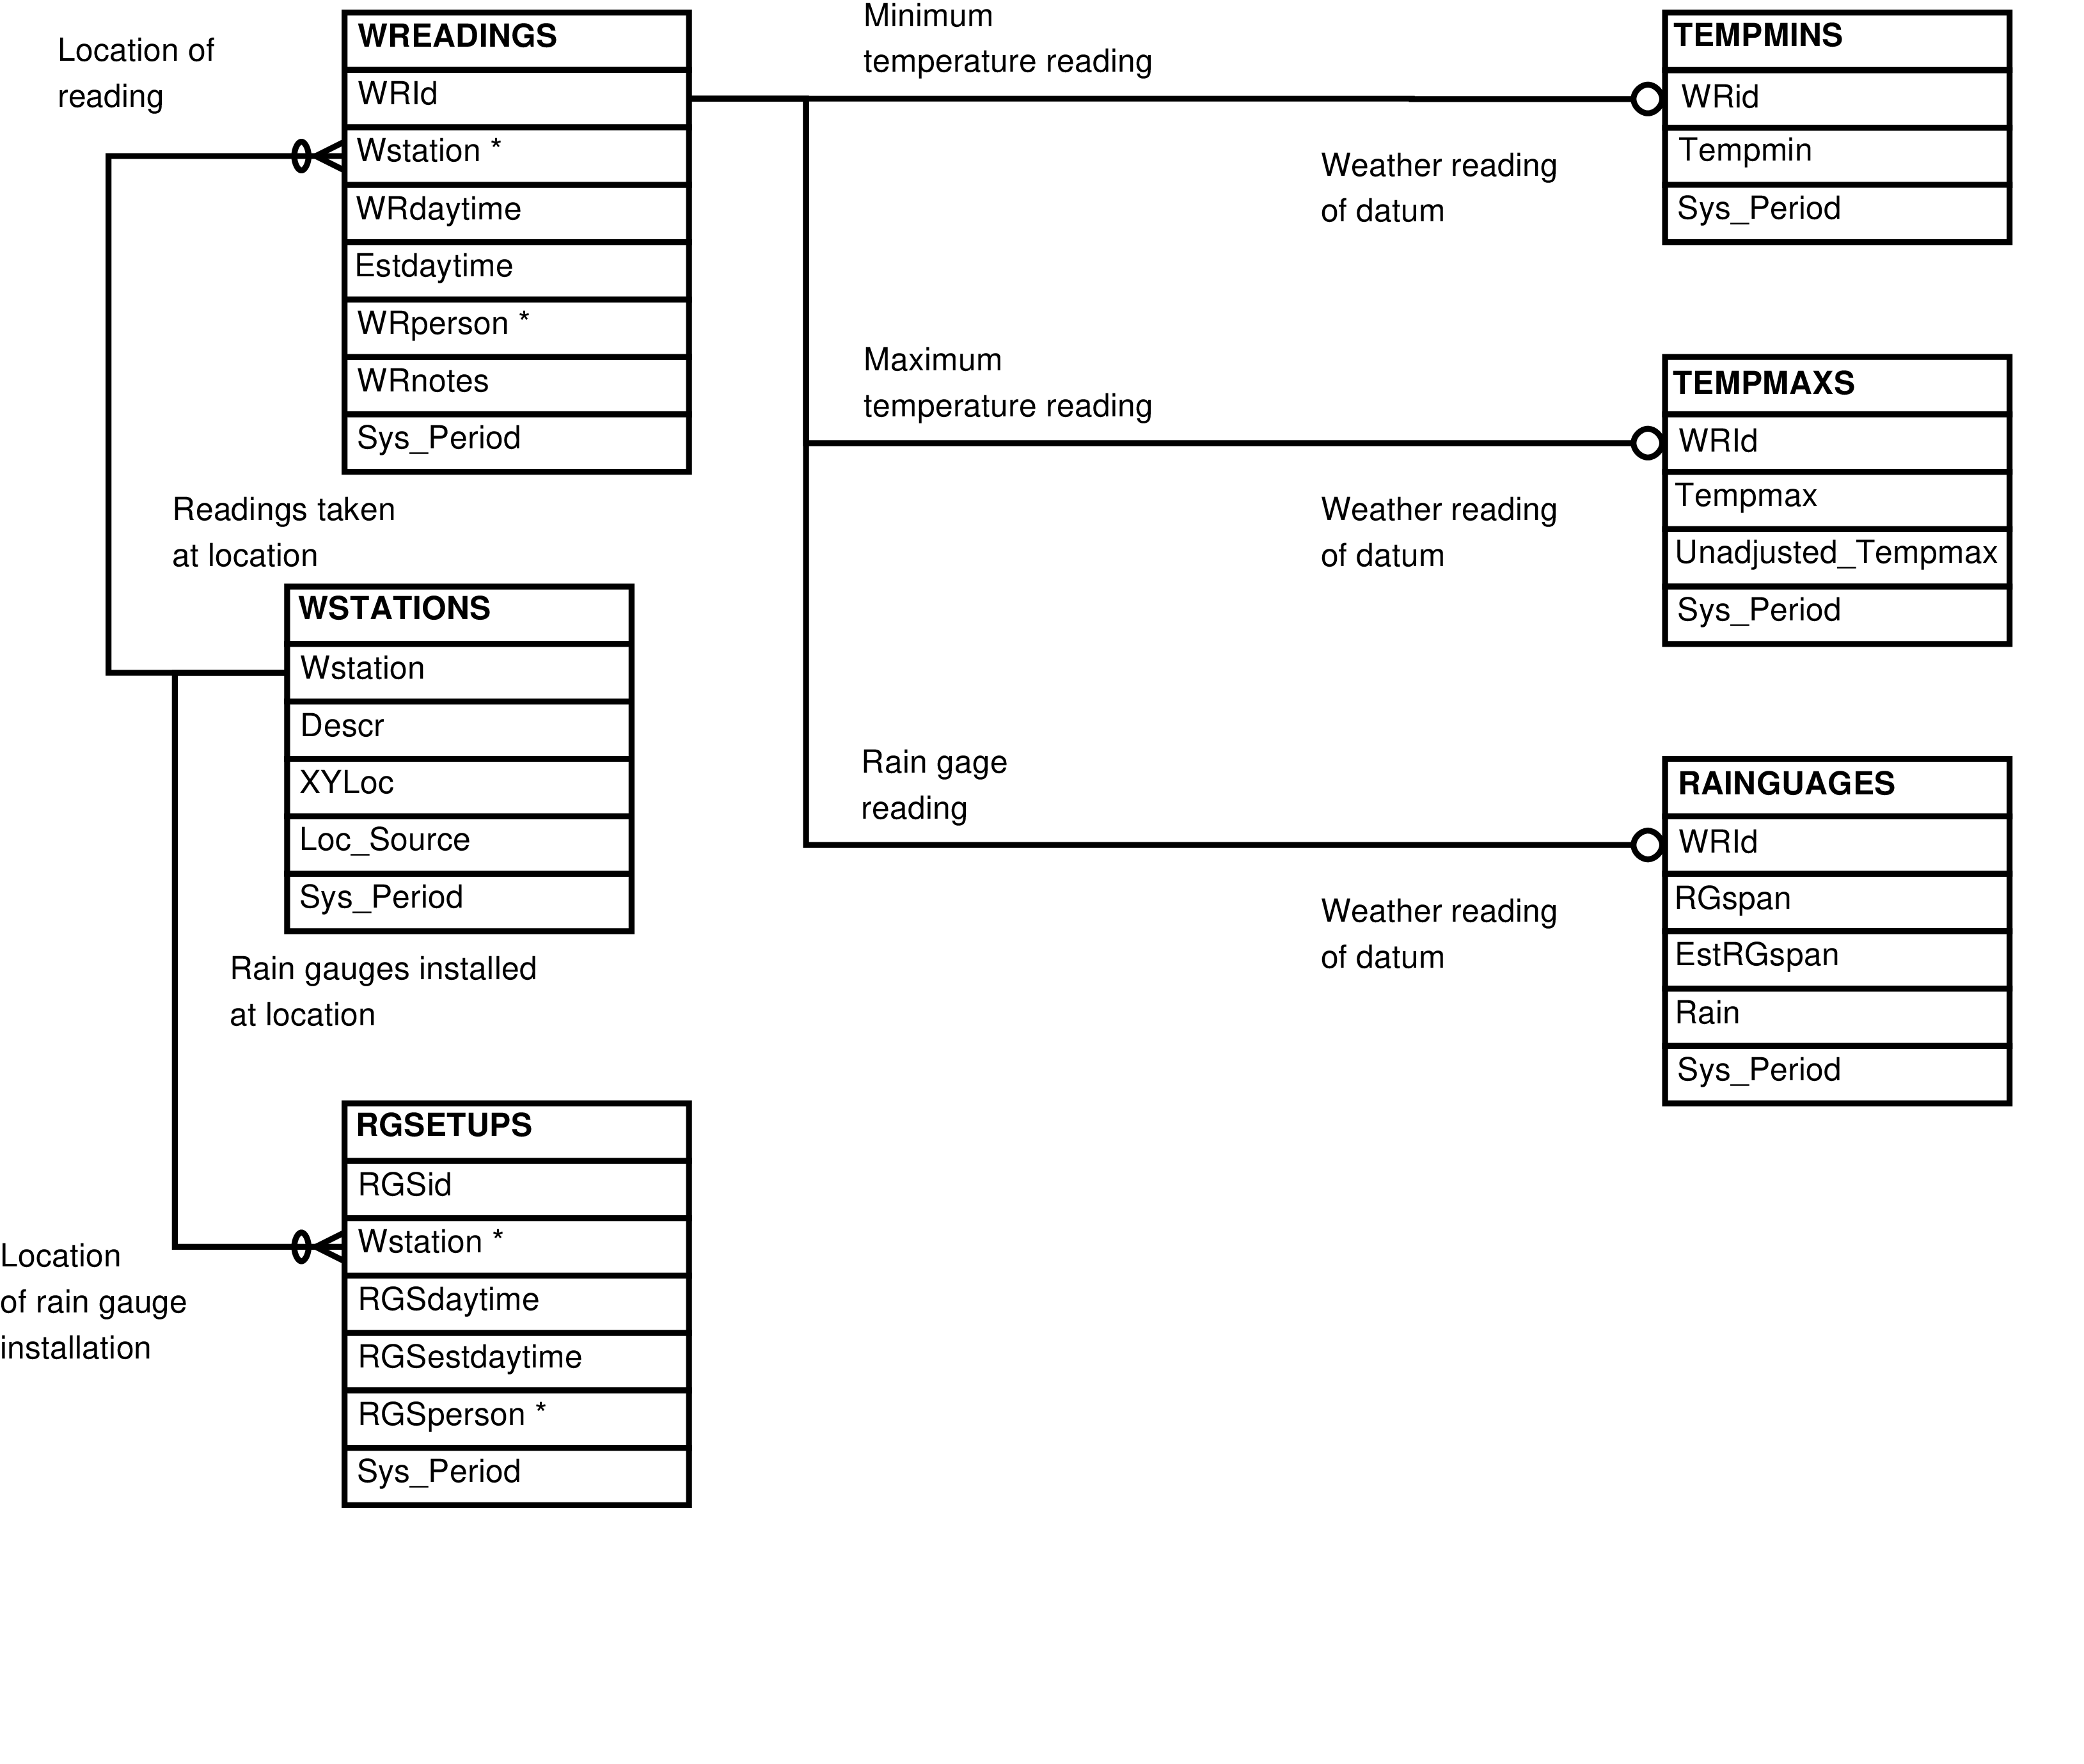
A relationship is established between the rows of two tables when an id value from one table appears as data in the other. The relationship notion is made most clear by way of diagrams and examples. If the next paragraph is unclear, don't worry. Have a look at the Babase diagrams below by way of example and see if that does not clear things up. The relationship concept is at the heart of relational databases and, while the underlying idea is rather simple, it took many years to develop relational database concepts[21] so don't expect a full understanding immediately.

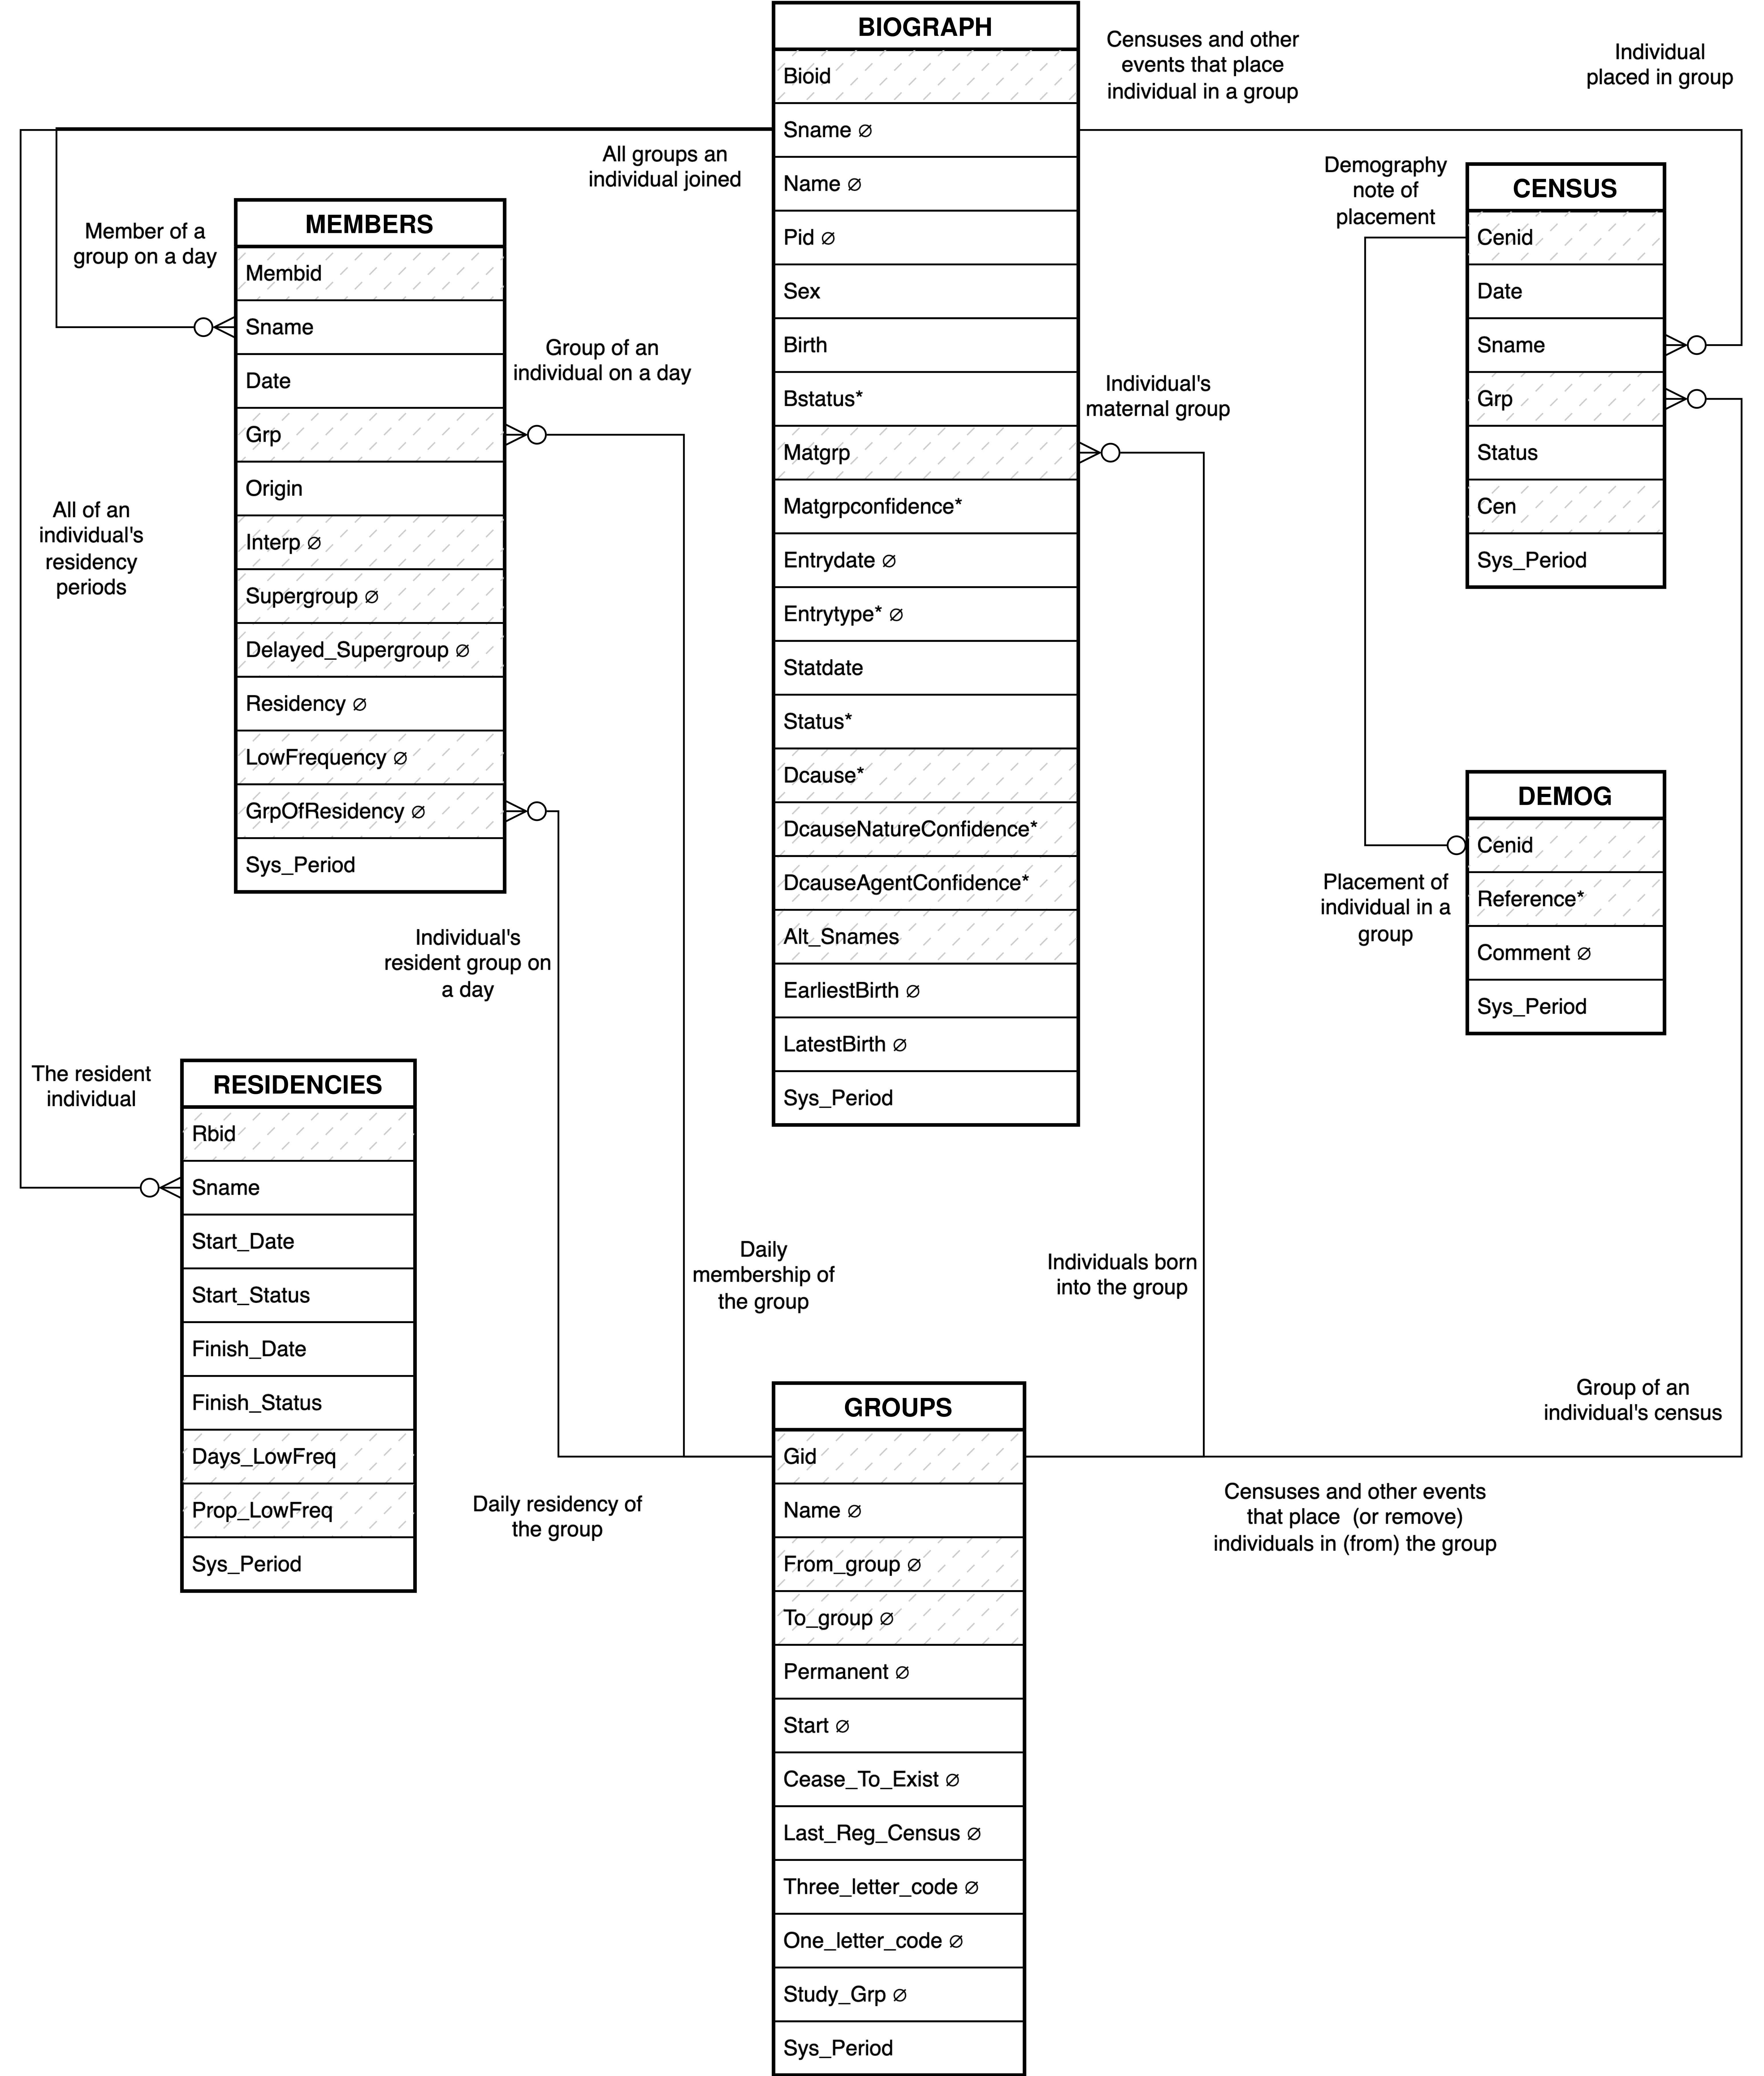
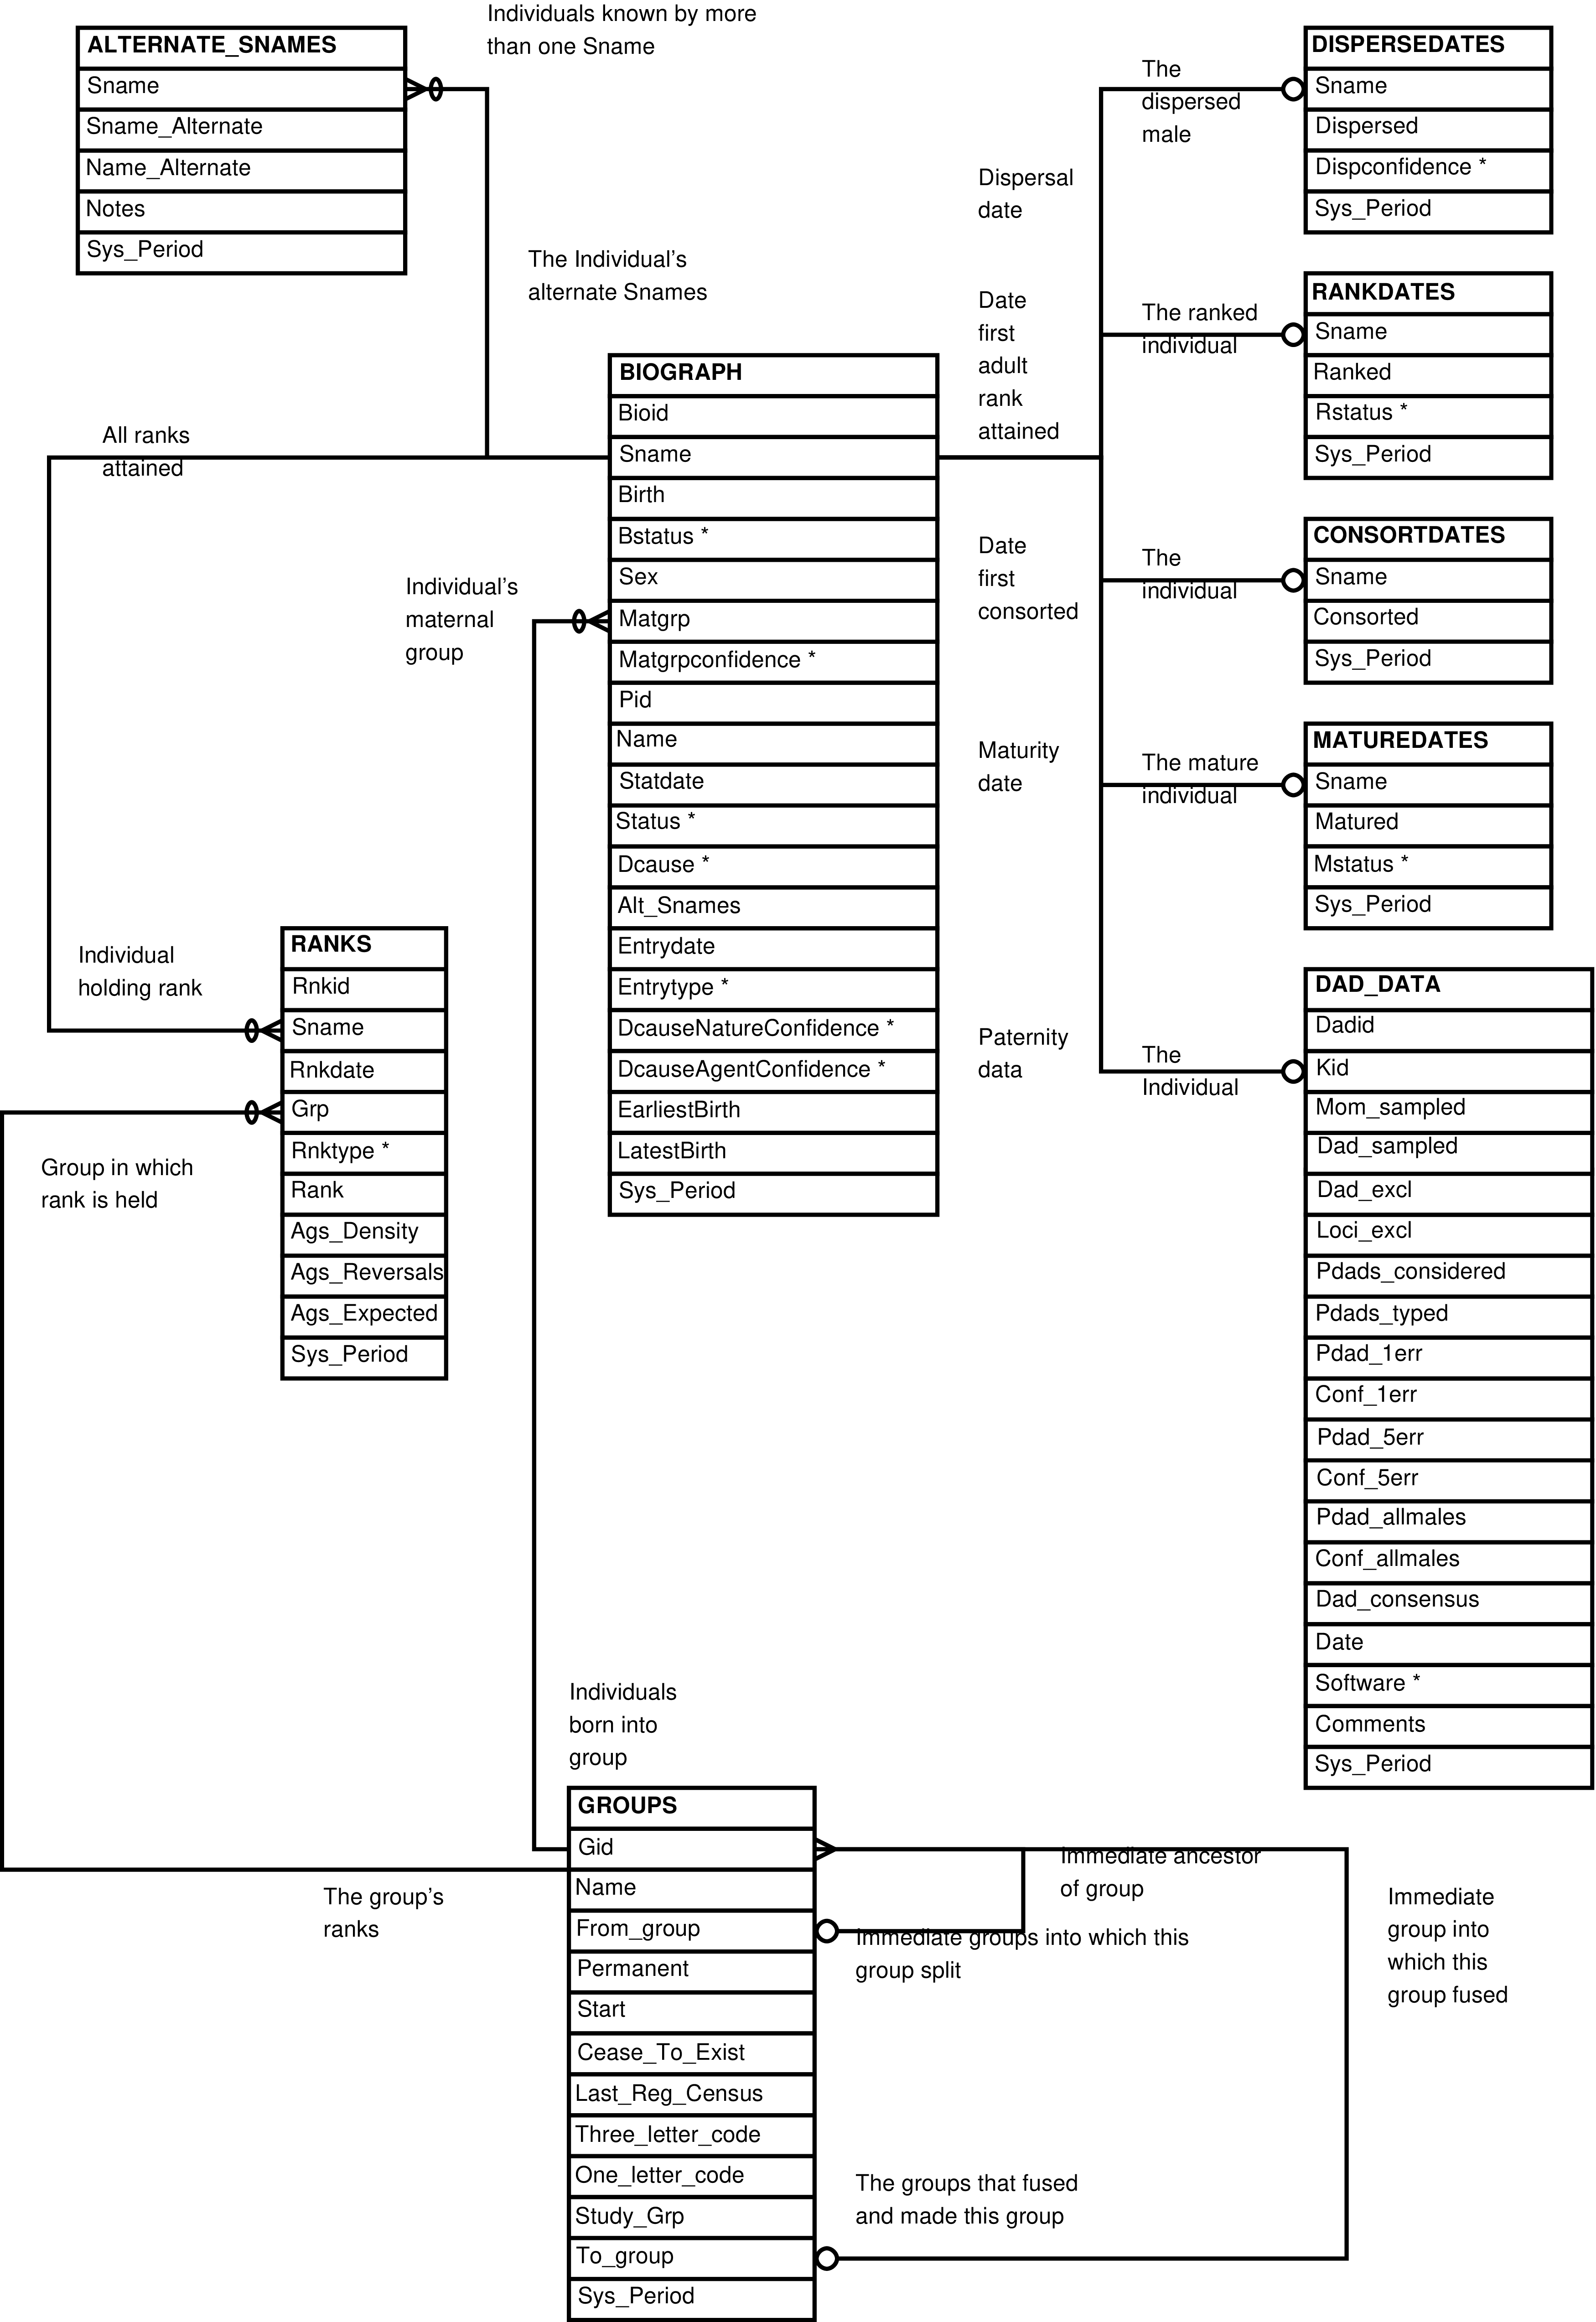
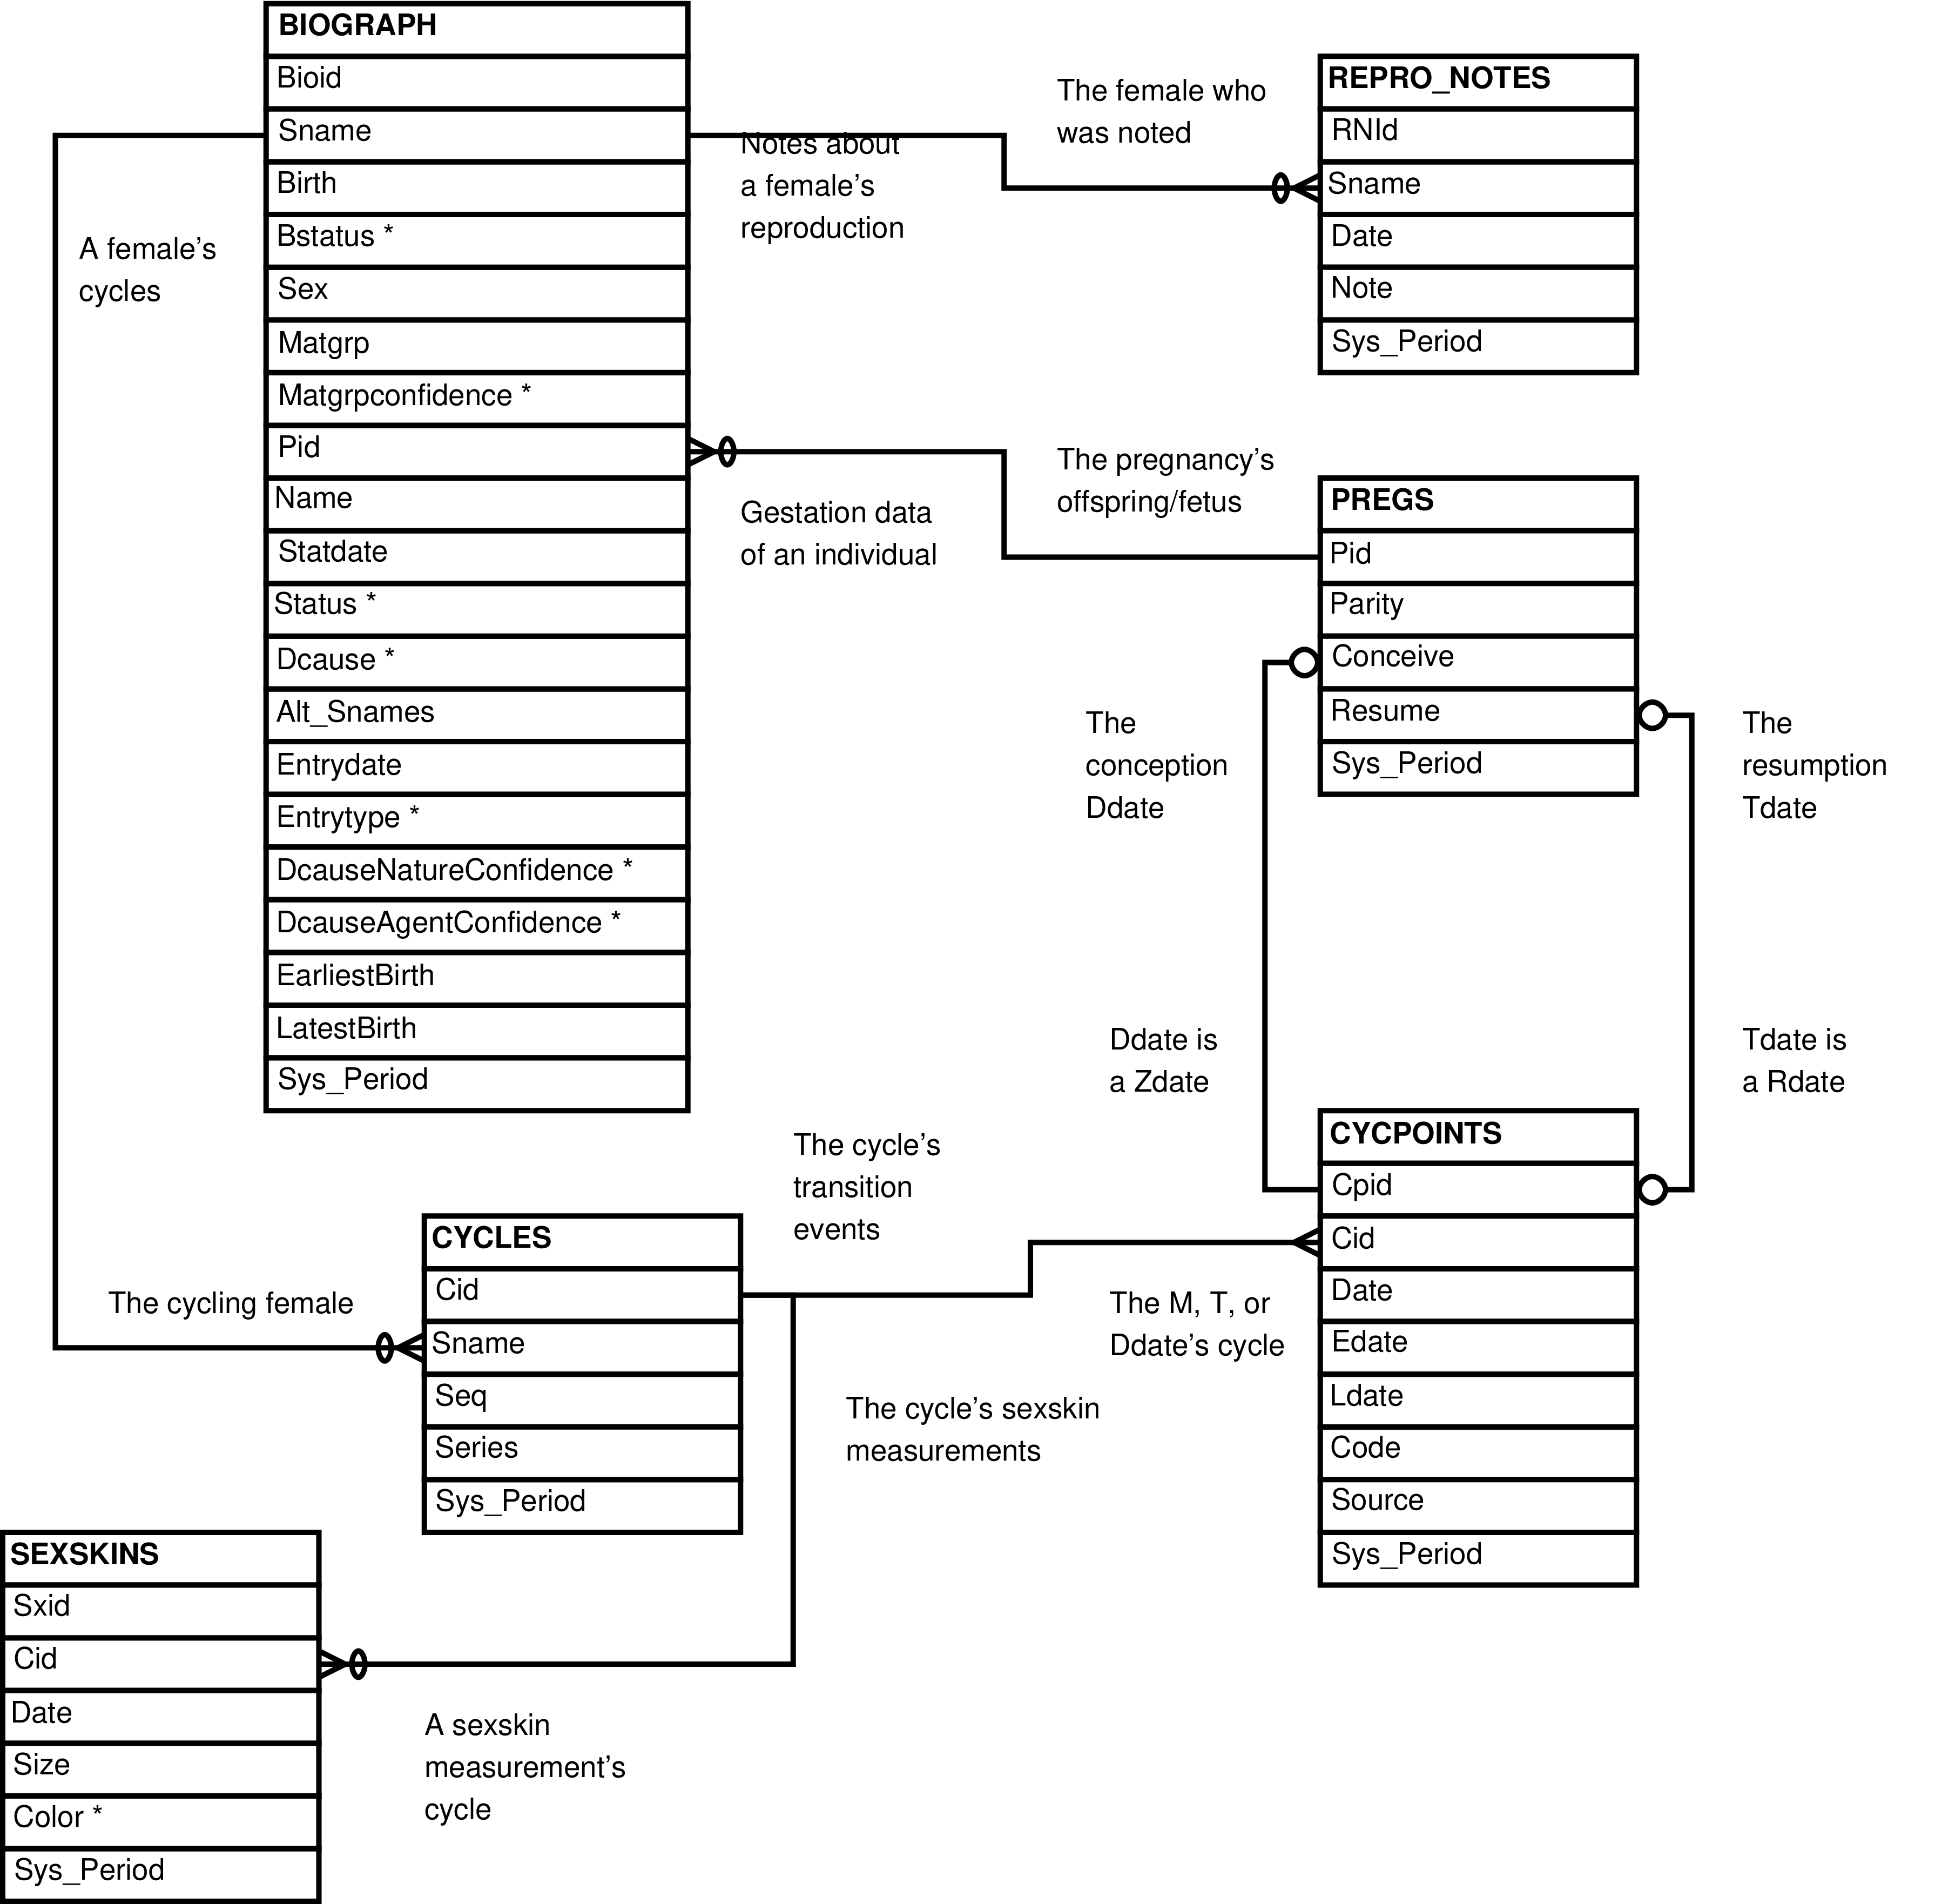
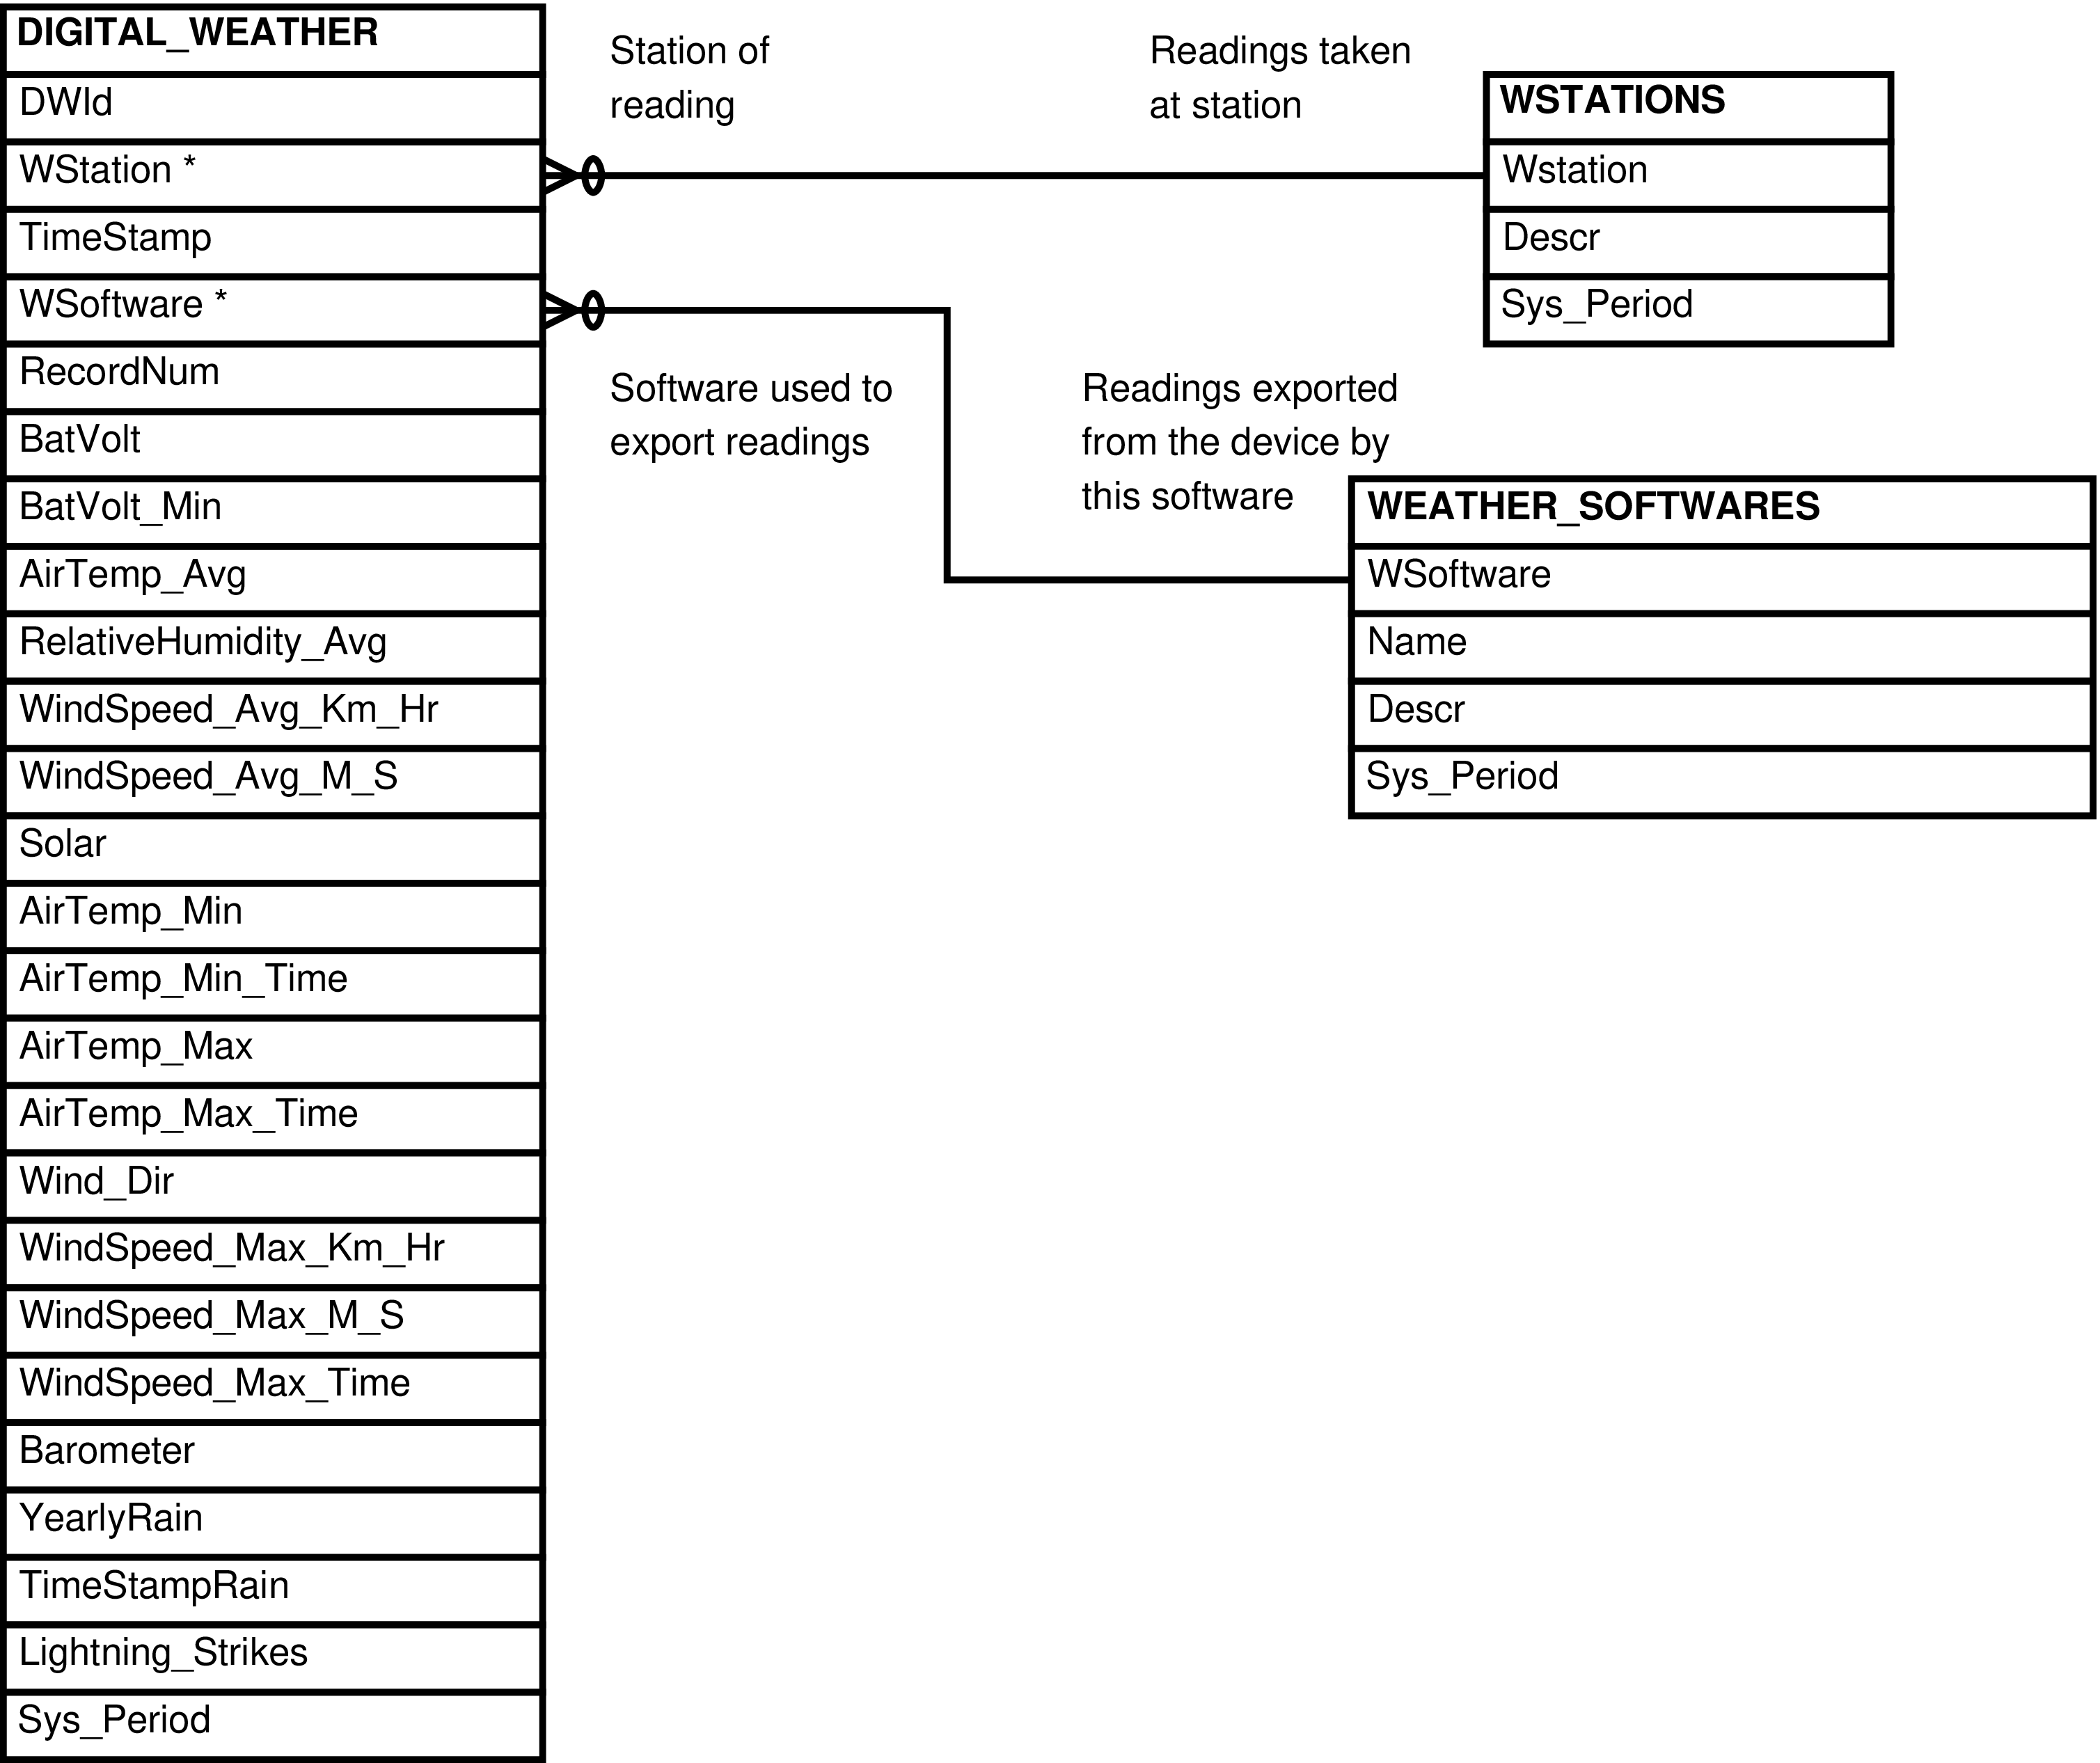
When an id value of a row in one table appears as data in a second table, the data in the second table can be used to retrieve the identified row from the first table.[22] When an id value of a row in the first table appears as data only once in the second table, the two tables are said to have a one-to-one relationship. One row in the first table relates to one (or possibly zero) row(s) in the second table. When a row's id value can appear in more than one row of a second table, the two tables are said to have a one-to-many relationship. One row of the first table can be related to many rows in the second table. One-to-many relationships are more common than one-to-one relationships. The relationship between the various Babase tables can be visualized in entity relationship diagrams, as shown here. In this diagram each table (entity) is a box, and each box contains a list of the table's columns. The lines between the boxes represent the relationships between the tables.

Note

If you have trouble viewing the diagrams in your browser, you may wish to view them in PDF format. The diagrams are available in The Babase Pocket Reference (approx. 4.8MB) in PDF form.

Figure 2.1. Key to the Babase Entity Relationship Diagrams

If we could we would display the diagram key here.


Figure 2.2. Babase Group Membership Entity Relationship Diagram

If we could we would display a diagram here depicting censusing and group membership.


Figure 2.3. Babase Life Events Entity Relationship Diagram

If we could we would display here a diagram depicting maturity markers and ranking.


Figure 2.4. Babase Sexual Cycle Entity Relationship Diagram

If we could we would display a diagram here depicting female sexual cycle information.


Figure 2.5. Babase Sexual Cycle Day-To-Day Tables Entity Relationship Diagram

If we could we would display a diagram here depicting female sexual cycle day-to-day tables.


Figure 2.6. Babase Social Interactions Entity Relationship Diagram

If we could we would display a diagram here depicting social interactions and focal point samples.


Figure 2.7. Babase Multiparty Interactions Entity Relationship Diagram

If we could we would display a diagram here depicting multiparty interactions.


Figure 2.8. Babase Darting Logistics and Morphology Entity and Relationship Diagram

If we could we would display a diagram here depicting darting logistics and morphology.


Figure 2.9. Babase Darting Physiology Entity and Relationship Diagram

If we could we would display a diagram here depicting darting logistics and morphology.


Figure 2.10. Babase Darting Samples Entity and Relationship Diagram

If we could we would display a diagram here depicting darting logistics and morphology.


Figure 2.11. Babase Darting Teeth and Ticks Entity and Relationship Diagram

If we could we would display a diagram here depicting darting logistics and morphology.


Figure 2.12. Babase Inventory Entity Relationship Diagram

If we could we would display a diagram here depicting the Babase Inventory tables.


Figure 2.13. Babase Physical Traits Hormone Data Entity Relationship Diagram

If we could we would display a diagram here depicting the Babase Physical Traits Hormone Data tables.


Figure 2.14. Babase Physical Traits Genetic Hybrid Score Data Entity Relationship Diagram

If we could we would display a diagram here depicting the Babase Physical Traits Genetic Hybrid Score Data tables.


Figure 2.15. Babase Physical Traits Wounds and Pathologies Data Entity Relationship Diagram

If we could we would display a diagram here depicting the Babase Physical Traits Wounds and Pathologies Data tables.


Figure 2.16. Babase SWERB Core Tables Entity Relationship Diagram

If we could we would display a diagram here depicting the SWERB core tables.


Figure 2.17. Babase SWERB Grove/Waterhole Location Tables Entity Relationship Diagram

If we could we would display a diagram here depicting the SWERB Grove/Waterhole Location tables.


Figure 2.18. Babase Manual Weather Data Entity Relationship Diagram

If we could we would display here a diagram depicting the manual weather data tables.


Figure 2.19. Babase Digital Weather Data Entity Relationship Diagram

If we could we would display here a diagram depicting the digital weather data tables.


[21] Don't try this at home! Trained Professionals Only! Etc. ;-)

[22] And the reverse is true. The id of a row in the first table can be used to find the row in the second table that holds it.


Page generated: 2024-04-22T16:19:03-04:00.